Are They Weeds or a Life Force? Or Sustainability on the Edge
Frank Drummond1,2, Elissa Ballman1, and Judith Collins1
1School of Biology and Ecology, University of Maine
2Cooperative Extension, University of Maine
Abstract: In 2014 and 2015 we surveyed 28 wild blueberry fields in Hancock, Knox, Waldo, and Washington Counties, Maine. We assessed and recorded the diversity, richness, and total abundance of flowering wildflowers along field edges. We also measured the foraging density of the bee community in these fields during bloom. Wildflowers that occur in the crop field are often considered weeds by blueberry growers. Wildflower taxa richness was quite high in many of the wild blueberry fields, with a mean of 11 taxa / field. We found that wildflower or weed density increased through the season both years and that wildflower taxa richness was significantly greater along field edges compared to the field interior. Wildflower richness was correlated with wildflower taxa diversity. Bee species richness was also high at 43 species captured in 2014. Wildflower diversity along edges determined the density of foraging bees in wild blueberry bloom and the foraging density of bees was a significant determinant of % fruit set in wild blueberry fields. Therefore, our conclusions are that wildflowers along field edges indirectly enhance fruit set, which is a requirement for increased yield. Wild blueberry growers who allow wildflowers to grow along field edges may indirectly increase crop yields by increasing wild native bee abundance, which in turn should result in higher levels of pollination. Management of field edges to maximize wildflower diversity should be part of an integrated native bee conservation plan implemented by growers that includes pollinator reservoirs and tactics that minimize pesticide exposure.
Keywords: wild blueberry, weeds, wildflowers, bee forage, bee community
Introduction
In the spring and early summer, the authors can be found in wild blueberry fields seeking and studying bees. Wild blueberries are a composite of up to five species and hybrids of our native Vaccinium taxa (Jones et al. 2014). The most abundant species in this complex of wild blueberries is Vaccinium angustifolium Aiton, the sweet lowbush blueberry (Bell et al. 2009, Jones et al. 2014). The wild blueberry species complex are native plants in the understory of northern North American forests. They grow in a vegetative manner in mature forests. When gaps in the forest canopy occur, the plants receive sunlight resulting in flower and fruit production (Drummond et al. 2009). Wild blueberry has been managed since the Native American people practiced the technique of slash and burn agriculture in Maine for wild blueberry production (Moore 1994). Forests were cut and burned and the resulting open habitat resulted in fruit production that was harvested for several subsequent years until the area became reforested. Early colonists copied this form of agriculture and practiced this traditional way of producing berries for commerce until just recently. Over the past 50 years, production has increasingly incorporated use of fossil fuels, mechanical equipment, pesticides, and honey bees (Drummond and Collins 1999).
“Increased wildflower diversity along field edges indirectly results in increased levels of pollination.”
Wild blueberries are entirely dependent upon bees for pollination services to produce fruit (Bell et al. 2009). Commercially reared honey bees and bumble bees are a very important production investment for pollination of wild blueberries (Drummond 2002, Drummond 2012, Asare et al. in review). However, investing in the rental or purchase of pollinators may not be economically viable over the long-term. First, hive rental costs for honey bees continue to escalate across the U.S. (Sumner and Boriss 2006, Rucker et al. 2012). Second, since 2006, honeybee populations have continually declined (National Research Council 2007). High rates of honey bee colony losses (averaging greater than 30%, vanEngelsdorp and Meixner 2010, Lee et al. 2015) have resulted in severe economic hardship for commercial beekeepers. Commercial bumble bees are not without their own problems, as some people believe they are a threat to wild native bumble bees (Colla et al. 2006). Although, Bushmann et al. (2012) in a two-year study did find evidence that the use of commercial bumble bees by growers resulted in an increased level of disease in the native wild bumble bee fauna in blueberry fields. Native bees are a natural resource that provide the valuable ecosystem service of pollination with a high value to Maine wild blueberry growers (Jones et al. 2014, Asare et al. in review).
Despite the instantaneous numerical advantage that commercial bees often provide growers, especially honey bees, native bees in the wild blueberry agro-ecosystem are on average more efficient pollinators on a per bee basis (Javorek et al. 2002, Drummond 2016). There are more than 120 species of wild native bees[1] associated with wild blueberries that we have documented (Bushmann and Drummond 2015). This is almost half of the native bee species richness throughout Maine (n=276 species, Dibble et al. in review). Many small wild blueberry farms in Maine rely exclusively on native bees for pollination (Rose et al. 2013 and Hanes et al. 2013), and farms that rent honeybees also benefit from additional pollination services from native bees (Asare et al. in review). These bees are a natural resource that have high economic value (Jones et al. 2014).
However, native bees are not always in high enough abundance to provide adequate pollination. Pathogens, pesticide exposure, and weather conditions affect their community abundance and foraging force (Ladurner et al. 2002, Mommaerts et al. 2010, Cameron et al. 2011, Bushman et al. 2012, Henry et al. 2012, Whitehorn et al. 2012, Pettis et al. 2013, Vanbergen 2013, Goulson 2015, Rundlöf et al. 2015, Drummond 2016). In Maine, floral resources appear to be the most important factor in determining their abundances in the wild blueberry agro-ecosystem (Groff et al. 2016). Although wild blueberry flowers provide a large food source for native bees, the bloom period only lasts three to four weeks and many native bee species need floral resources both before and after that period (Venturini et al. 2017a, 2017b). In addition, most wild blueberry fields are managed on a biennial cycle and so flowers are present for native bees only every other year (Yarborough 2009, Drummond 2016). Because native bees rely on alternative floral hosts when blueberry flowers are not in bloom, many farmers are beginning to plant pollinator reservoirs (Venturini et al. 2017a). It has been demonstrated in Maine that the planting of pollinator reservoirs can not only sustain native bee populations in blueberry fields, but increase their abundance resulting in increases in blueberry yield (Venturini et al. 2017b).
Wildflowers should not only be thought of as bee food resources that need to be planted in order to enhance bee pollinator populations. We have also shown that floral resources in landscapes surrounding wild blueberry can result in increased native bee abundance in wild blueberry fields (Bushmann and Drummond 2015, Groff et al. 2016). However, wild blueberry fields also have flowering resources within the field and along the field edges. Farmers and agricultural researchers often refer to these flowering plants as weeds since many species can reduce blueberry yield (Yarborough and Marra 1996). Many of these species do result in yield loss (Yarborough et al. 2017) and so are a focus of control. But are these plants (weeds) also a food resource for native bees that might enhance bee abundance and pollination? The trade-off between bee enhancement and weed increase might not be present along wild blueberry field edges, areas that are not significant in berry production because of shading and poor soils. Shading and poor soil along blueberry field edges often result in less berry production. Therefore, this trade-off between bee enhancement and weed increase might not be present along wild blueberry field edges. Can wildflowers exist such that their weediness is minimal, but their enhancement of bees is significant? To answer part of this question, we conducted a survey of the diversity and abundance of wild floral resources and native bees in and along the edges of wild blueberry fields in two of Maine’s major wild blueberry growing regions.
Methods
Field sites. We sampled blooming wildflowers that were likely to be visited by bees for either nectar or pollen along the edges and within 12 wild blueberry fields in 2014 and 16 fields in 2015. Native bees were sampled in the same fields during these years. In 2014, six fields were sampled in Hancock County and six fields were sampled in Knox and Waldo Counties for bees. In 2015, seven fields were located in Maine’s Downeast growing region (Hancock and Washington counties) and nine fields were located in Maine’s mid-coastal blueberry growing region (Knox and Waldo counties). Six of the seven fields in Downeast Maine were conventionally managed fields and located on the blueberry barrens; whereas, the remaining Downeast site was a small organic field. The sites in mid-coast Maine were a mix of organic and conventional fields.
Floral survey. In 2014, the Knox and Waldo County fields were sampled for wildflowers two times: once during early bloom (early May), and during the early fruit ripening stage in July. The fields in Hancock County were sampled for wildflowers three times, once during early bloom (early May), once during peak bloom (late May) and once during early fruit ripening in July. In 2015, each field was sampled three times: early bloom, during early fruit development, and during fruit ripening (May, June, and July; respectively). To sample a field, we walked a transect through the interior of the field and then a transect along the field edges and visually identified and assessed the abundance of all plants in flower. Plant taxa such as wind pollinated trees and grasses were not included in our surveys; although, see Stubbs et al. (1992) for records of wind pollinated plant pollen collected by native bees. Flowering plant abundance was quantified as the percentage of the transect the flowing plants made up and were classified as: 0%, < 1%, 1%, 2%, 3-5%, 10%, or > 10%. Plant identification was either determined in the field when known taxa were encountered or samples were pressed and taken back to the laboratory where specimens were keyed and verified by Dr. Alison Dibble, School of Biology and Ecology, University of Maine, Orono, ME. The Shannon-Wiener diversity index was calculated in an Excel spreadsheet (Shannon 1948).
Blueberry bloom and native bee sampling. Native bee abundance was determined in each surveyed field in both 2014 and 2015. Relative abundance was measured by placing water filled colored bowl traps (three colors: white, yellow and blue) in each field during bloom (see Bushmann and Drummond (2015) for more details). Bees were sampled using colored bowl traps on two dates; peak bloom (late May) and late bloom (early to mid-June). For each sample date, there were three replications of each color in each field. Cups were placed such that the top of the cup was even with the top of the blueberry canopy. Each cup was filled ¾ full with water. A drop of unscented dish-washing detergent was added to the water to break the surface tension. Traps were left in the field for 24 hrs. At collection, traps from each site of the same color were pooled and brought back to the laboratory where they were placed in urine cups with 70% ethyl alcohol for sorting and identification. Individual bees in 2014 (but not 2015) were sent to Dr. Sara Bushmann (Blue Hill, ME), Dr. Rob Jean (Indianapolis, IN) and Dr. Jason Gibbs (University of Saskatchewan, Sask.) for identification to species. Richness and Shannon-Wiener diversity indices were estimated using the software EstimateSTM (Colwell 2009).
To estimate absolute bee abundance or foraging density, the number of honey bees and native bees were counted in each of 15, 1.0 m2 quadrats per site for 1 minute per field. Quadrats were placed arbitrarily across each field. Quadrat sampling was conducted at early bloom, peak bloom, and late bloom at each field during both years. The counts were averaged across the 15 quadrats and three sampling times to estimate the mean number of native bees foraging on 1.0 m2 of wild blueberry flowers per minute (see Drummond 2012 for more detail).
In both 2014 and 2015 mid-May (early bloom), six blueberry clones (genetically distinct plants, referred to as genets) were arbitrarily selected within each of the 28 fruit-bearing wild blueberry fields. In each selected clone, we counted the number of flowers on each of six stems. The stems were marked with numbered metal plant tags. In late June, three marked stems from each clone were cut, placed in individual zip-lock bags, and brought into the laboratory where fruit-set was evaluated by counting the number of developing fruit on each stem and calculating the percentage of fruits based upon the original flower counts per stem (see Venturini et al. 2017b for more detail).
Statistical analysis: All statistical analyses were performed using the statistical software JMP12® (JMP 2015). Prior to analysis, all nested subsamples of the wildflower and bee communities were pooled by estimating the average so that each field had a single measure of field edge and interior wildflower richness, diversity, and abundance. Native bee bowl trap counts and native bee foraging density (bees / m2 / min) were averaged to obtain a single field-level estimate of bee relative abundance and absolute abundance, respectively. Linear Pearson correlation was used to determine the association among the three measures of the blooming wildflower community in wild blueberry fields; richness, diversity, and abundance. We used general linear models (ANOVA) to test the hypothesis that field edges had significantly richer and more abundant wildflower communities than field interiors (year, field location, and the interaction were fixed effects). To determine if native bee foraging density was dependent upon the floral resources along wild blueberry field edges we modeled native bee foraging density (bees / m2 / min) as the dependent variable with year, wildflower diversity and their interaction as fixed effects. The effect of native bee foraging density on percent fruit set and yield were also modeled using general linear models with year and native bee density and their interaction as fixed effects. Residual of all models were visually inspected to determine if transformation of dependent or independent variables was necessary.
Results
Plant Survey 2014. In the Downeast (Hancock Co.) plant survey, the May sample documented seven flowering plant taxa. Both the edges and interior of the fields had less than 1% of the landscape area in alternative floral bloom, though the range varied from 0 to 5% in bloom. The July sample documented 20 taxa. The average land cover in bloom was less than 1% for both within and along the field edges with a range of 0 to 10% in bloom.
In the Mid-coast (Knox and Waldo Co.) plant survey, the May sample documented five plant taxa in flower, 14 taxa in the June sample, and 17 in the July sample along field edges and within the blueberry fields (Table 1). Each sample period had an average of less than 1% of the landscape in bloom for the edges and interior of the fields. Each sample date had a bloom range from 0 to 5% of the landscape in bloom. Overall, there was no difference between wildflower richness in the Downeast vs the Mid-coast wild blueberry fields (P > 0.05).
Violets were the most common flowering plant species being found in all twelve of the fields we sampled followed by dandelion (10 fields), bluets (9), bunchberry (8), clover (8), and cinquefoil (7). When plant species were assessed as a proportion of total flowering alternative plant bloom, violets were again the most important followed by dandelion, clover, wild strawberry, bluet, and wild cherry. There was a significant positive correlation between taxa richness (number of flowering plant species) and taxa diversity (Shannon-Wiener) of flowering plants (r = + 0.919, P < 0.01), but not between flowering plant richness or diversity and floral density (P > 0.05).
Plant Survey 2015. Downeast surveys documented five flowering plant taxa in the May survey, 10 in June, and 18 in July. The Mid-coast surveys recorded six flowering plant taxa in May, 25 in June, and 33 in July (Table 1). The total number of flowering taxa in and around fields increased over time as in 2014, but again there was no significant difference between Mid-coast and Downeast fields (P > 0.05). The average percent blooming land cover rating was less than 1% for both sets of fields both along field edges and within the field interior. Landscape bloom percentages ranged from 0 to 5% for our southern sites and 0 to 10% for our Downeast sites; although, the vast majority of sites Downeast were less than 1%. Eight percent of Mid-coast fields had no bloom in field edges; whereas, 30% of Downeast field edges had no bloom during the course of this survey.
Table 1. Flowering plant taxa observed flowering in Maine blueberry fields (2014-2015).
Cinquefoil was the most common flowering plant species being found in 14 of 16 fields we sampled followed by red sorrel (12 fields), blue-eyed grass (11) dandelion, dogbane, and hawkweed (9), and black-eyed Susan, bunchberry, meadowsweet and milkweed (8). When plant species were assessed as a proportion of total flowering alternative plant bloom, vetch, St. John’s wort, black-eyed Susan, clover, cinquefoil, and milkweed were the most abundant in terms of floral density. Flowering plant richness increased throughout the season over both years and both regions (F(1,6) = 31.977, P = 0.001). There was no significant year effect or region x year inter-action (P > 0.05). There was a significant positive correlation between taxa richness and taxa diversity of flowering plants (r = + 0.539, P = 0.031), and between flowering plant diversity and floral density (r = + 0.689, P = 0.003), but not between taxon richness and floral density (P = 0.097); although, a trend does appear to exist.
In both years, a high proportion of the wildflower taxa were exotic (Table 1), but both exotic and native taxa are utilized by the native bee fauna in Maine wild blueberry.

Overall, pooling across both years, wildflower taxa richness was significantly correlated with taxa diversity (r = + 0.643, P = 0.0002), but richness and diversity were not related to floral density (P > 0.05). All three wildflower community metrics: richness, diversity and abundance were significantly greater along wild blueberry field edges than within field interiors (P < 0.05). Figure 1 shows that flowering plant taxa richness was significantly greater along field edges than field interiors over both years (field location: F(1,52) = 97.234, P < 0.0001; year x field location interaction, P > 0.05) .
“Both exotic and native taxa are utilized by the native bee fauna in Maine wild blueberry.”
Native Bee Sampling. We recorded 43 native bee species by deployment of bowl traps in the 28 wild blueberry fields in 2014 and 2015 (Table 2). An estimate of the 95% confidence intervals about the bee richness is 34.9 – 51.0%, and the Shannon-Wiener estimate of taxa diversity is 2.95. The most abundant species were the sand bee Andrena carlini Cockerell; the social sweat bee, Augochlorella aurata Smith; the sand bee, Andrena rufosignata Cockerell; the sweat bee, Lasioglossum leucocomum (Lovell), the sand bee Andrena vicina Smith; and the sweat bee Halictus ligatus Say. Bumble bees are usually under-sampled by bowl traps and so relative abundance is likely underestimated. Our quadrat sampling is based upon visual estimates of the foraging honeybee and native bee community. Bumble bee queens are easily identified to genus and recorded during sampling. Quadrat sampling in 2014 revealed a bumble bee (Bombus spp.) queen density of 17.9% of the total native bee community. Our combined bowl trap and quadrat sampling suggest that sand bees (Andrenidae: Andrena spp.) made up the greatest relative abundance of the native bee community at 44.7%, followed by sweat bees (Halictidae), 24.3%. The third most abundant group of native bees were bumble bees (Apidae: Bombus spp.). Several of the fields were also stocked with honeybees. Honey bees comprised 48.2% of the total bee abundance in wild blueberry fields during bloom.
Table 2. Bee species collected with bowl traps in 2014.
Estimates of the bee community from bowl trapping are quite efficient at estimating richness, but less effective for estimating the bee foraging density during blueberry bloom. In 2014 and 2015 there was no correlation between native bee bowl capture numbers and the native bee foraging density recorded in quadrats (P = 0.61). Because of this we only used the bee foraging density (bees / m2/ min) to assess floral resource effects on the abundance of the bee community and the relationship between bee community abundance and pollination, measured as fruit set.
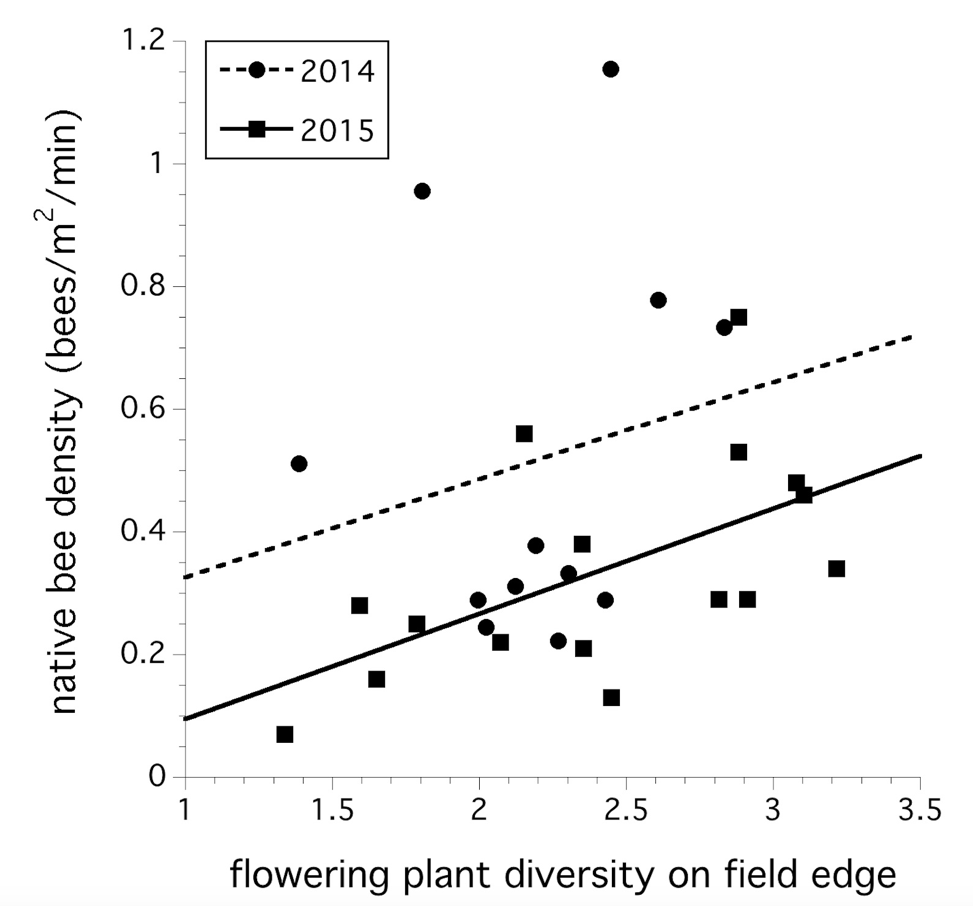
The plant community along the edge of wild blueberry fields explained the variation in the native bee foraging community abundance sampled in 2014 and 2015. A model including year, plant diversity and plant density suggests that year (F(1,24) = 6.665, P = 0.017) and plant diversity was significant (F(1,24) = 4.688, P = 0.041, Fig. 2). There was no year x plant diversity interaction (P > 0.05)
“The significant relationship between wildflower diversity and bee community foraging abundance suggests that not only is the abundance of floral resources important, but the abundance of a range of wildflower species is also important.”
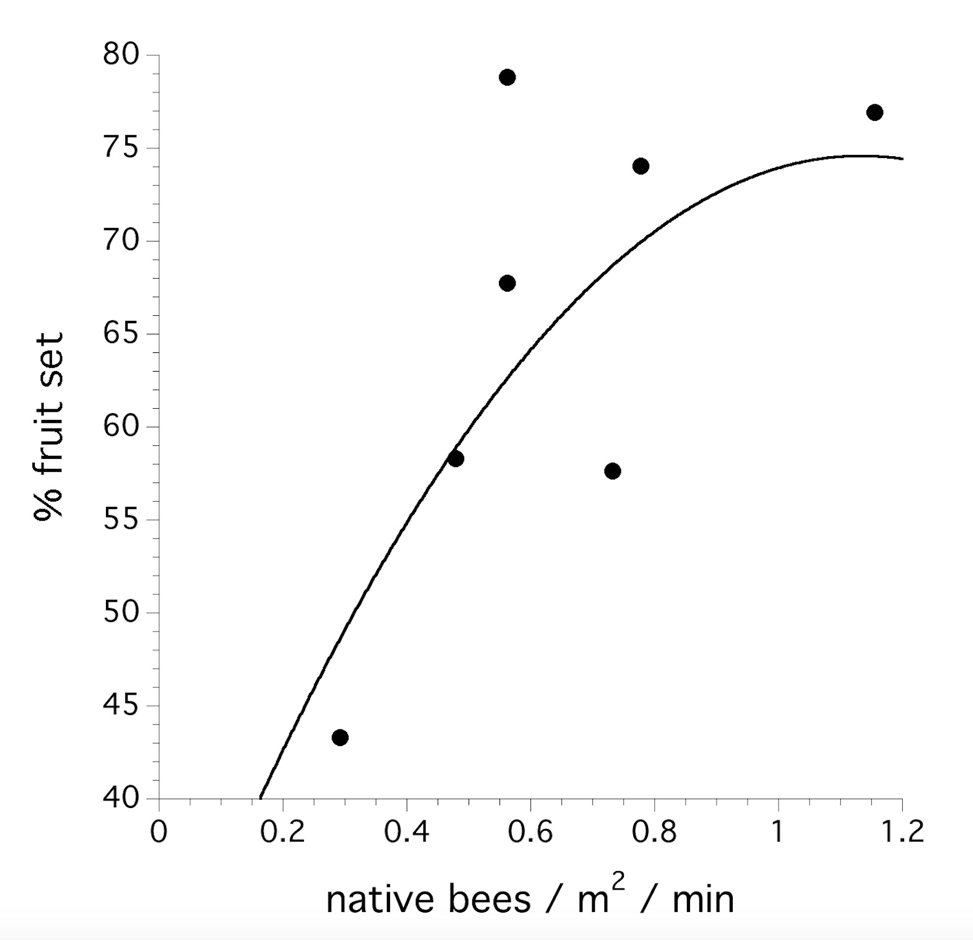
Honey bees were stocked in 21 of the 28 fields. In order to assess the independent effect of the native bee community abundance on pollination level, we modeled fruit set and yield (kg berries / ha) with native bee foraging density only in the fields without honeybees (n=7). Native bee community abundance (logistic transformation) did explain variation in fruit set (F(1,5) = 8.726, P = 0.032, Fig. 3). Year and the interaction of year and native bee community abundance was not significant (P > 0.05). The native bee foraging density did not explain yield (P > 0.05).
–
Discussion
We found that wild blueberry field edges were rich in wildflower taxa (Fig. 4). This wildflower community was significantly greater than the wildflower community in the field interiors. Weeds in wild blueberry fields are comprised of both native and introduced exotic wildflowers (our study, Table 1; and Yarborough and Hess 2002). They can cause crop loss (Jensen and Yarborough 2004, Yarborough et al. 2017) and should be controlled when economic thresholds are reached (Yarborough and Marra 1996, Yarborough and Cote 2016). Wild blueberry growers are reluctant to allow weeds to become problematic in fields, even though increased weed density has been shown to enhance native bees and resulting yield (Bushmann et al. 2012, Yarborough et al. 2017). However, the positive effect of within field weed densities on native bee species richness and abundance has not been found to be a consistent dynamic across all fields and years (Bushmann and Drummond 2015).

Field edges are not productive areas for fruit culture in most wild blueberry fields. This is due to the nature of wild blueberry fields. Fields are clear-cut sections of forest maintained in primary succession to encourage growth and flowering of wild blueberry plants (Yarborough 2009, Drummond et al. 2009). Therefore, field edges interface with shaded forest stands. Along the field edge wild blueberry plants are etiolated and generally lack flower buds due to the lack of direct sunlight (Bell et al. 2009, Jones et al. 2014). Because of reduced productivity, field edges are minimally managed by wild blueberry growers, except to prevent weed seed inoculum buildup and dispersal into field interiors.
“Bee size often reflects the flower species that is accessible for nectar extraction (Heinrich 1976), the main energy food for adult foraging bees. Therefore, from a bee community perspective, it is important that wildflower forage in a locale be highly diverse in order to provide food for all species and at the same time minimize competition.”
We found evidence that the wildflower community taxa diversity in this low productivity area of wild blueberry fields determines the native bee foraging density in a field. The Shannon-Wiener diversity metric of wildflower diversity is essentially a multivariate variance (Hill 1973) that represents both wildflower taxa richness and abundance. The significant relationship between wildflower diversity and bee community foraging abundance suggests that not only is the abundance of floral resources important, but the abundance of a range of wildflower species is also important. We found a richness of 43 bee species during the 2014 survey (n = 12 fields). This bee community richness was expected and is representative of the 127 bee species recorded by Bushmann and Drummond (2015) from 40 wild blueberry fields surveyed between 2010 and 2012. The range in bee size (measured as the inter-tegula (IT) distance) of the community that we documented ranged from 0.91 mm (Lasioglossum heterognathum (Mitchell)) – 6.7 mm (Bombus ternarius Say, queen) (see Chapin (2014) for details on IT measurements). Bee size often reflects the flower species that is accessible for nectar extraction (Heinrich 1976), the main energy food for adult foraging bees. Therefore, from a bee community perspective, it is important that wildflower forage in a locale be highly diverse in order to provide food for all species and at the same time minimize competition.
Native bee foraging density was also shown to determine fruit set, a measure of pollination level. This finding is consistent with previous studies of ours (Bushmann and Drummond 2015, Venturini 2017b, Yarborough et al. 2017, Asare et al. in review). The failure to show a direct relationship between the native bee foraging density or fruit set and yield is not surprising. Yield is dependent upon fruit set, but phenomena such as disease, weeds, and insect pests, can negatively affect yield; while fertility, weather, and irrigation can positively affect yield (Yarborough et al. 2017). Therefore, increased wildflower diversity along field edges indirectly results in increased levels of pollination. This response may be dependent upon the landscape that surrounds a particular blueberry field. Groff et al. (2016) showed that the landscape surrounding a wild blueberry field determines bee community abundance (30-50% of the variance in bee abundance explained by landscape). In addition, pesticide exposure (Drummond and Stubbs 1997, although see Bushmann and Drummond 2015) and weather (Drummond 2016) can determine the bee foraging density. On the other hand, the seed bank along field edges will for the most part determine the wildflower diversity along with management. The seed bank contribution is a stochastic property of the field in which the grower has no control. Therefore, relying upon wild blueberry field edges to enhance the bee community and resulting pollination has a high degree of uncertainty that we cannot quantify at this point.
Pollinator plantings or “pollinator reservoirs” in which growers till a section of their field and plant wildflowers for bees is a method that reduces some of this uncertainty. This practice has been shown to be successful in both wild blueberry in Maine (Venturini et al. 2017b) and in highbush blueberry in Michigan (Blaauw and Isaacs 2012). The advantage of a planting is that the land area and wildflower richness and density can be determined; although, with some uncertainty. However, there is a cost to planting and maintaining a pollinator reservoir. We showed that the annualized costs, given the resulting increase in pollination that we documented with a 1:45 pollinator planting to field ratio in areas, takes four years to recover the costs from net farm income. Therefore, while pollinator reservoirs may be a consistently superior approach to enhancing native bee abundance, field edge management for wildflowers is a less expensive approach to native bee enhancement and should be considered by all growers, even those who rely heavily on commercial honeybee or bumble bee importation. In addition, field edge management should be viewed as part of a conservation management plan for native bees that includes pollinator reservoirs and tactics that minimize pesticide exposure to bees.
In conclusion, wild blueberry field edge management has great relevance to enhancing bees in a sustainable economic and ecological manner.
Acknowledgements
We would like to thank the Maine wild blueberry growers that allowed us to conduct research in their fields. Dr. Sara Bushmann, Dr. Rob Jean, and Dr. Jason Gibbs are thanked for identification of the various taxa of bees collected in 2014. And Dr. Alison Dibble is acknowledged for her verification of several wildflower species determinations. We would also like to thank two anonymous reviewers for their suggestions on this manuscript that led to its improvement. This is Maine Agricultural Experiment Station journal article number 3510. This research was supported by the following grant: U.S. Department of Agriculture National Institute of Food and Agriculture – Specialty Crops Research Initiative Contract/Grant/Agreement No. 2011-51181-30673.
Notes
[1] Native bees are all wild, except for the Impatient bumble bee, Bombus impatiens (Say) which is both wild and commercially reared and sold. In this publication, we use the term “native bees” to refer to all wild native bees.
Literature Cited
Asare, E., A.K. Hoshide, F.A. Drummond, X. Chen, and G.K. Criner. In Review. Economic risk of bee pollination in Maine wild blueberry, Vaccinium angustifolium Aiton. J. Econ. Entomol.
Bell, D.J., L.J. Rowland, J. Smagula, and F.A. Drummond. 2009. Recent Advances in the Biology and Genetics of Lowbush Blueberry. Maine Agric. For. Exp. Stn., University of Maine, Orono. Tech. Bull. 36 pp.
Bushmann, S.L., F. A. Drummond, L. A. Beers, and E. Groden. 2012. Wild bumblebee (Bombus) diversity and Nosema (Microsporidia: Nosematidae) infection levels associated with lowbush blueberry (Vaccinium angustifolium) production and commercial bumblebee pollinators. Psyche 2012 Article ID 429398, 11 pp., doi:10.1155/2012/429398.
Blaauw, B. R., and R. Isaacs. 2012. Larger wildflower plantings increase natural enemy density, diversity, and biological control of sentinel prey, without increasing herbivore density. Ecol. Entomol. 37: 386–394.
Bushmann, S. and F.A. Drummond. 2015. Abundance and diversity of wild bees (Hymenoptera: Apoidea) found in lowbush blueberry growing regions of Downeast Maine. Environ. Entomol. 43: 1 -15.
Cameron, S.A., J.D. Lozier, J.P. Strange, J.B. Koch, N. Cordes, L.F. Solter, and T.L. Griswold. 2011. Patterns of widespread decline in North American bumble bees. Proc. Nat. Acad. Sci. 108(2): 662-667.
Chapin, S. 2014. The Application of Spatial Modeling Tools to Predict Native Bee Abundance in Maine’s Lowbush Blueberries. MS Thesis, University of Maine, Orono, Maine, 53 pp.
Colla, S.R., M.C. Otterslatter, R.J. Gegear. and J.D. Thomson. 2006. Plight of the bumble bee, pathogen spillover from commercial to wild populations. Biol. Conserv. 129(4): 461-467.
Colwell, R.K. 2009. EstimateS and User’s Guide: Statistical estimation of species richness and shared species from samples. Version 8.2. Available from: http://viceroy.eeb.uconn.edu/estimates.
Dibble, A.C., F.A. Drummond, C. Stubbs, J. Ascher, and M. Veit. In Review. A review of bee research in Maine with a state species checklist. N.E. Natur.
Drummond, F.A. and C.S. Stubbs. 1997. Potential for management of the blueberry bee, Osmia atriventris Cresson. Proceedings of the Sixth International Symposium on Vaccinium Culture. Acta Hort. 446: 77-86.
Drummond, F.A. and J. Collins. 1999. History of insect pest management for lowbush blueberries in Maine. Trends in Entomol. 3: 23-32.
Drummond, F.A. 2002. Honey Bees and Blueberry Pollination. Wild blueberry factsheet. Number 629, University of Maine Cooperative Extension, University of Maine.
https://extension.umaine.edu/blueberries/factsheets/bees/629-honey-bees-and-blueberry-pollination/
Drummond, F, J. Smagula, S. Annis and D. Yarborough. 2009. Organic Wild Blueberry Production. University of Maine Agric. and Forestry Exp. Stn. Tech. Bull. 852: 43 pp.
Drummond, F.A. 2012. Commercial bumblebee pollination of lowbush blueberry. Intl. J. Fruit Sci. 12(1-3): 54-64.
Drummond F.A. 2016. Behavior of bees associated with the wild blueberry agro-ecosystem in the USA. Intern. J. Entomol. & Nematol. 2(1): 21-26.
Goulson, D., E. Nicholls, C. Botías, and E.L. Rotheray. 2015. Bee declines driven by combined stress from parasites, pesticides, and lack of flowers. Sci. 347(6229): 1255957.
Groff, S.C., C.S. Loftin, F.A. Drummond, S. Bushmann, and B. McGill. 2016. Spatial prediction of lowbush blueberry native bee pollinators in Maine, USA. Environ. Model. & Soft. 79: 1-9.
Hanes, S.P., K. Collum, A. K. Hoshide, F. Drummond, and E. Asare. 2013. Grower perceptions of native pollinators and pollination strategies in the lowbush blueberry industry. Ren. Agric. Food Syst. 28 (4), 1-8.
Heinrich, B. 1976. Resource partitioning among some eusocial insects: bumblebees. Ecol. 57(5): 874-889.
Henry M., M. Béguin, F. Requier, O. Rollin, J.F. Odoux, P. Aupinel, J. Aptel, S. Tchamitchian, and A. Decourtye. 2012. A common pesticide decreases foraging success and survival in honey bees. Sci. 336(6079): 348-50.
Hill, M.O. 1973. Diversity and evenness: a unifying notation and its consequences. Ecol. 54: 427-432.
Javorek, S.K., K.E. Mackenzie, and S.P. Vander Kloet. 2002. Comparative pollination effectiveness among bees (Hymenoptera: Apoidea) on lowbush blueberry (Ericaceae: Vaccinium angustifolium). Ann. Entomol. Soc. Am. 95(3):345–351.
Jensen, K.I. and Yarborough, D.E., 2004. An overview of weed management in the wild lowbush blueberry—past and present. Small Fruits Rev. 3(3-4): 229-255.
Jones, M.S., H. Vanhanen, R. Peltola, and F.A. Drummond. 2014. A global review of arthropod-mediated ecosystem-services in Vaccinium berry agroecosystems. Terr. Arth. Rev. 7: 41-78.
Ladurner, E., F. Santi, B. Maccagnani, and S. Maini. 2002. Pollination of caged hybrid seedrape with Osmia cornuta and Apis mellifera. Bull. Insect. 55(1-2): 9-11.
Lee, K.V., N. Steinhauer, K. Rennich, M.E. Wilson, D.R. Tarpy, D.M. Caron, R. Rose, K.S. Delaplane, K. Baylis, E.J. Lengerich, J. Pettis, J.A. Skinner, J.T. Wilkes, R. Sagili, D. vanEngelsdorp. 2015. A national survey of managed honey bee 2013–2014 annual colony losses in the USA. Apidol. 46(3):292–305.
Mommaerts, V., S. Reynders, J. Boulet, L. Besard, G. Sterk, and G. Smagghe. 2010. Risk assessment for side-effects of neonicotinoids against bumblebees with and without impairing foraging behavior. Ecotox. 19: 207. doi:10.1007/s10646-009-0406-2.
Moore, J.N., 1994. The blueberry industry of North America. HortTech. 4(2): 96-102.
National Research Council (NRC). 2007. Status of pollinators in North America. The National Academies Press, Washington, D.C., USA.
Pettis, J.S., E.M. Lichtenberg, M. Andree, J. Stitzinger, and R. Rose. 2013. Crop pollination exposes honey bees to pesticides which alters their susceptibility to the gut pathogen Nosema ceranae. PLoS One 8(7), p.e70182.
Rose, A., F.A. Drummond, D.E. Yarborough, and E. Asare. 2013. Maine wild blueberry growers: A 2010 economic and sociological analysis of a traditional Downeast crop in transition. MAFES Misc. Rep. 445.
Rucker, R., W. Thurman, and M. Burgett. 2012. Honey bee pollination markets and the internalization of reciprocal benefits. Am. J. Agric. Econ. 94(4):936–977.
Rundlöf, M., G.K. Andersson, R. Bommarco, I. Fries, V. Hederström, L. Herbertsson, O. Jonsson, B.K. Klatt, T.R. Pedersen, J. Yourstone, and H.G. Smith. 2015. Seed coating with a neonicotinoid insecticide negatively affects wild bees. Nature 521 (7550): 77-80.
Shannon, C. E. 1948. A mathematical theory of communication. Bell Syst. Tech. Journ. 27: 379–423 and 623–656.
Stubbs, C.S., H.A. Jacobson, E.A. Osgood, and F.A. Drummond. 1992. Alternative forage plants for native (wild) bees associated with lowbush blueberry, Vaccinium spp., in Maine. MAES Tech. Bull. 148. 54 pp.
Sumner, D.A., and H. Boriss. 2006. Bio-economics and the leap in pollination fees. University of California, Giannini Foundation of Agricultural Economics, Agric. Res. Econ. Update 9(3): 9–11.
Vanbergen, A.J. 2013. Threats to an ecosystem service: pressures on pollinators. Front. Ecol. Environ. 11(5): 251-259.
vanEngelsdorp, D., and M. Meixner. 2010. A historical review of managed honey bee populations in Europe and the United States and the factors that may affect them. J. Invert. Path. 103:580–595.
Venturini, E.M., F.A. Drummond, A. K. Hoshide, A. C. Dibble, and L. B. Stack. 2017a. Pollination reservoirs for wild bee habitat enhancement: a review. J. Agroecol. Sustain. Food Syst. 41(2): 101-142.
Venturini, E.M., F.A. Drummond, A. K. Hoshide, A. C. Dibble, and L. B. Stack. 2017b. Pollination Reservoirs in Maine Lowbush Blueberry. J. Econ. Entomol. DOI: http://dx.doi.org/10.1093/jee/tow285
Whitehorn P.R., S. O’Connor, F.L. Wackers and D. Goulson. 2012. Neonicotinoid pesticide reduces bumble bee colony growth and queen production. Sci. 336: 351- 352.
Yarborough, D.E. and M.C. Marra. 1996. August. Economic thresholds for weeds in wild blueberry fields. VI International Symposium on Vaccinium Culture, Acta Hort. 446: 293-302.
Yarborough, D.E. and T. Hess, 2002. Weeds. University of Maine Extension Factsheets No. 241-249. Univ. Maine, Orono, ME. https://extension.umaine.edu/blueberries/factsheets/weeds/.
Yarborough, D. 2009. Wild blueberry culture in Maine. University of Maine Extension Factsheet no. 2088.
Yarborough, D.E. and J.L. Cote. 2016. Evaluation of fall and spring applications of herbicides targeting resistant weeds in wild blueberry fields. Proc. First Ann. Meeting N.E. Plant, Pest, and Soils Conf. 125.
Yarborough, D.E., F. Drummond, S. Annis, and J. Cote. 2017. Maine Wild blueberry systems analysis. Acta Hort. In Press.