Blue Online Evaluation of Teaching Response Rates for Fall 2019
Approximately 70% of courses at UMaine have adopted online student evaluations of teaching using the Blue system as of fall 2019. Overall response rates are at 53.7%, which is common for online evaluations However, there is room for improvement. UMaine encourages providing in-class time for the completion of evaluations, something that other institutions have found to be effective for increasing response rates.1
In an effort to understand whether there is a relationship between providing in-class time for completing evaluations and response rates, we will examine the response rates for fall 2019 classes evaluated in Blue. Toward that end, we invite all faculty who used Blue in the fall to take this short survey.
We recently sent faculty who used Blue in the fall a newsletter highlighting response rate information and ways students interacted with Blue. Here are a few highlights from that document:
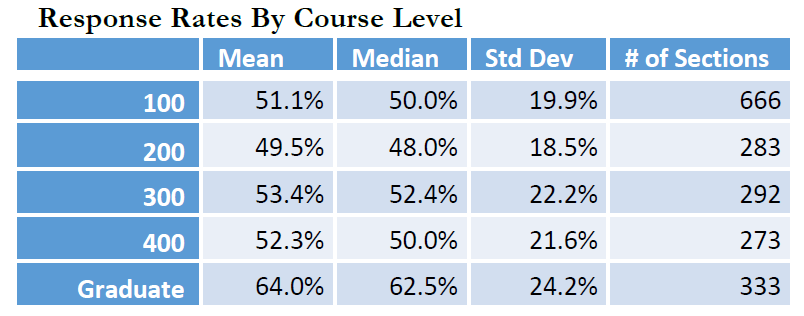
Mean undergrad response rates were consistently around 50% while graduate rates were a bit higher at 64%.
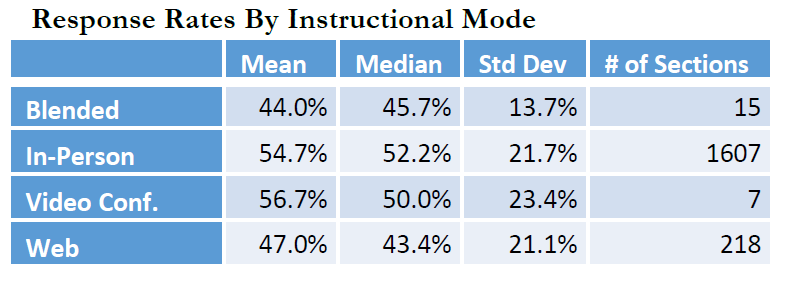
In-person and video conference courses had better mean response rates than web-based or blended courses.
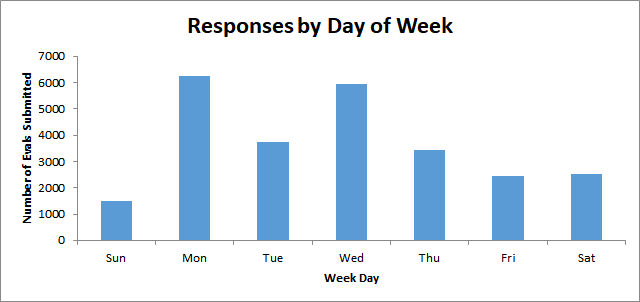
Mondays and Wednesdays had the best response rates.
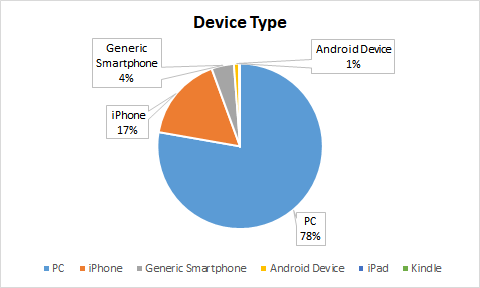
Most students used a computer, and not a phone or tablet, to complete their evaluations.
For more information on online student evaluations of teaching, please contact Ryan Weatherbee (ryan.a.weatherbee@maine.edu).
1 Kuch, F., Roberts, R. (2018) Electronic in-class course evaluations and future directions. Assessment & Evaluation in Higher Education, 44(5), 726-731. doi: 10.1080/02602938.2018.1467878
Young, K., Joines, J., Standish, T., & Gallagher, V. (2018). Student evaluations of teaching: the impact of faculty procedures on response rates. Assessment & Evaluation in Higher Education,44(1), 37-49. doi: 10.1080/02602938.2018.1532491