Multisensory Information Access
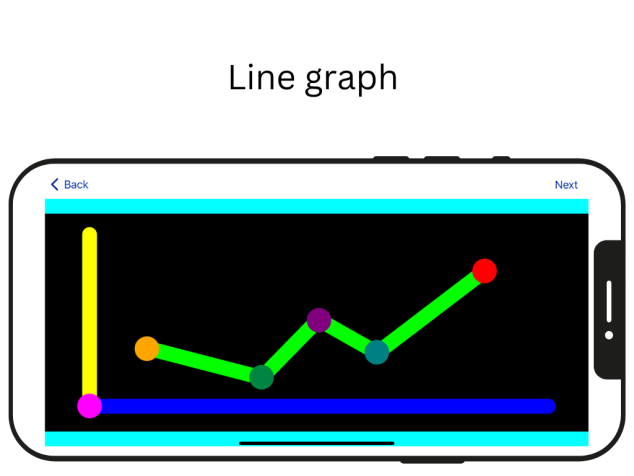
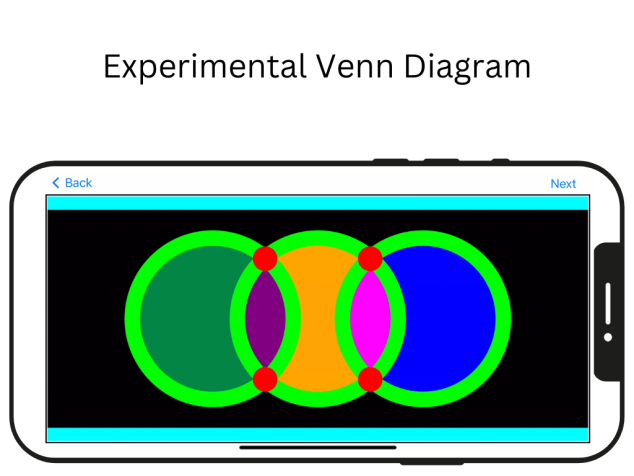
Data visualization. Often used as a catch-all term for making complex information sets more accessible through visual and graphic representation, much modern-day data visualization is anything but accessible to many users. Most data representations are produced in predominantly visual forms, meaning there are significant access disparities between individuals who are blind or have low vision (BLV) and their sighted peers, disparities that are exacerbated when such information is presented on digital screens.
Standard accessibility solutions rely heavily on natural language processing, such as screen readers, for non-visual information access. At VEMI, we’re exploring how a range of modalities, such as touch audio, and enhanced visual can be effective for learning graphical content rendered on touchscreens. These new interactions, called multisensory user interfaces, can be used to present all types of graphical content and information traditionally only conveyed visually.


Selected Research
Tennison, J.L., Goswami, S., Hairston, J.R., Uesbeck, P.M., Smith, D.W., Giudice, N.A., Stefik, A., & Gorlewicz, J.L. (in press). Bridging the Gap of Graphical Information Accessibility in Education with Multimodal Touchscreens Among Students with Blindness and Low Vision. Journal of Visual Impairment and Blindness.
Doore, S.A., Dimmel, J., Kaplan, T.M., Guenther, B.A., & Giudice, N.A. (2023). Multimodality as Universality: Designing inclusive accessibility to graphical information. Frontiers in Education, vol 8, p. 92. DOI: 10.3389/feduc.2023.1071759 (corresponding author).
Herbert, V.M., Perry, R.J., LeBlanc, C., Haase, K.N., Corey, R.R., Giudice, N.A., and Howell, C.L. (2021). Developing a smartphone app with augmented reality to support virtual learning of nursing students on heart failure. Clinical Simulation in Nursing. 54 (2021), 77-85. DOI: https://doi.org/10.1016/j.ecns.2021.02.003
Gorlewicz, J.L., Tennison, J.L., Uesbeck, P.M., Richard, M.E., Palani, H.P., Stefik, A., Smith, D.W., & Giudice, N.A. (2020). Design Guidelines and Recommendations for Multimodal, Touchscreen-Based Graphics. ACM Transactions on Accessible Computing (TACCESS), 13(3), Article 10 (30 pages). DOI: 10.1145/3403933
Tennison, J.L., Uesbeck, P.M., Giudice, N.A., Stefik, A., Smith, D.W., & Gorlewicz, J.L. (2020). Establishing Vibration-based Tactile Line Profiles for Use in Multimodal Graphics. Transactions on Applied Perception, 17(2), 1-14. DOI: 10.1145/3383457
Palani, H. P., Fink, P. D., & Giudice, N. A. (2020). Design Guidelines for Schematizing and Rendering Haptically Perceivable Graphical Elements on Touchscreen Devices. International Journal of Human-Computer Interaction, 1-22. DOI: 10.1080/10447318.2020.1752464 (corresponding author).
Teisl, M.F., Noblet, C.L., Corey, R.R., and Giudice, N.A. (2018). Seeing clearly in a virtual reality: Tourist reactions to an offshore wind project. Energy policy, 122(2018), 601-611. DOI: 10.1016/j.enpol.2018.08.018
Tennison, J.L., Carril, Z.S., Giudice, N.A., and Gorlewicz, J.L. (2018). Comparing Graphical Pattern Matching on Tablets and Phones: Large Screens are Not Necessarily Better. Optometry and Vision Science, 95(9), 720-726. DOI: 10.1097/OPX.0000000000001274
Palani, H. and Giudice, N.A. (2017). Principles for designing large-format refreshable haptic graphics using touchscreen devices: An evaluation of nonvisual panning methods. ACM Transactions on accessible Computing (TACCESS), 9(3). Article 9 (25 pages). DOI: 10.1145/3035537 (corresponding author).
Gershon, P., Klatzky, R. L., Palani, H., & Giudice, N.A. (2016). Visual, tangible, and touch-screen: Comparison of platforms for displaying simple graphics. Assistive Technology, 28(1), 1-6. DOI: 10.1080/10400435.2015.1054566
O‘Modhrain, S., Giudice, N.A., Gardner, J. A., & Legge, G.E. (2015). Designing media for visually-impaired users of refreshable touch displays: Possibilities and pitfalls. Transactions on Haptics, 8(3), 248-257. DOI: 10.1109/TOH.2015.2466231
Pawluk, D.T., Bourbakis, N., Giudice, N.A., Hayward, V., & Heller, M. (2015). Haptic assistive technology for individuals who are visually impaired. Transactions on Haptics, 8(3), 245-247. DOI: 10.1109/TOH.2015.2476735
Klatzky, R.L., Giudice, N.A., Bennett, C.R., & Loomis, J.M. (2014). Touch-screen technology for the dynamic display of 2D spatial information without vision: Promise and progress. Multisensory Research, 27(5-6), 359-378. DOI: 10.1163/22134808-00002447

