Model Validation
The free-surface elevation (h), water level, salinity, and the East-West (E-W) and North-South (N-S) velocities were validated in locations throughout the northeastern region of the model domain using observational data from 2021 and 2022 as shown in the figure below. In addition to this validation, a previous version of this model with a smaller domain has been validated in other locations in the bay (see Alahmed et al. 2022, and Alahmed, 2021 for more details).
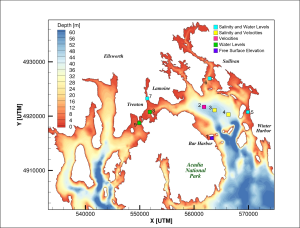
Locations of data validation in the model domain, numbered 1-9. Station 1 corresponds to NOAA’s Bar Harbor data station (https://tidesandcurrents.noaa.gov/stationhome.html?id=8413320).
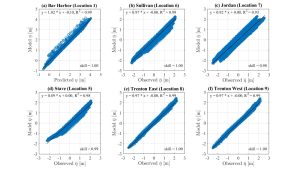
Validation of the free surface elevation and water levels in 2021. a) Free surface elevation, h, measured by the National Oceanic and Atmospheric Administration’s (NOAA) data station at Bar Harbor (tidesandcurrents.noaa.gov/stationhome.html?id=8413320) compared to the modeled h. b-f) water level elevation, measured at validation locations 5-9 (see map above) vs. the modeled water level.
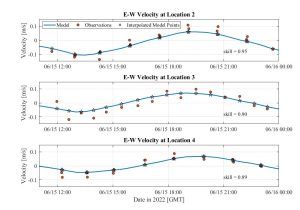
Validation of the depth-averaged East-West velocities in 2022 at locations 2-4. Velocity observations (red circles) were measured by a ship-mounted Acoustic Doppler Current Profiler (ADCP) during a tidal cycle (~12.5 h) survey on June 15th, 2022. The modeled data (blue line) was interpolated onto the time vector of the observed data (black stars) before calculating the model skill score (see Wilmott, 1981).
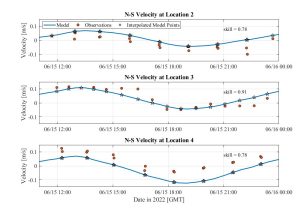
Validation of the depth-averaged North-South velocities in 2022 at locations 2-4.
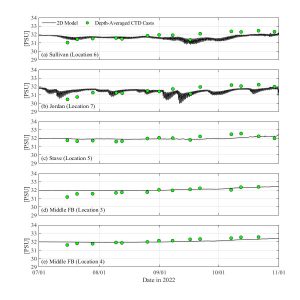
Validation of the depth-averaged salinity in Frenchman Bay in 2021. Observed salinity (green circles) was measured in casts by a SonTek CastAway-CTD and depth-averaged to compare to the modeled salinity at locations 3-7 in the bay.