projects at compumaine
microenvironment disruption in tumorous breasts
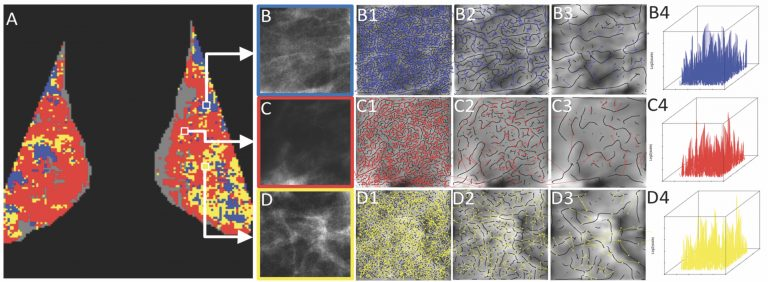
We successfully demonstrated preliminary evidence that tissue disruption and loss of homeostasis in breast tissue microenvironment and breast bilateral asymmetry can be quantitatively and objectively assessed from mammography via a localized, wavelet-based analysis of the whole breast. The WTMM method was used to quantify density fluctuations from mammographic breast tissue via the Hurst exponent (H). Each entire mammogram was cut in thousands of 360×360 pixel sub-regions in a gridding scheme of overlapping sliding windows, with each window boundary separated by 32 pixels. The WTMM method was applied to each sub-region individually. The density fluctuations in healthy mammographic breast tissue are either monofractal anti-correlated (H<1/2) for fatty tissue or monofractal long-range correlated (H>1/2) for dense tissue. However, tissue regions with H~1/2, as well as left vs. right breast asymmetries, were found preferably in tumorous (benign or cancer) breasts vs. normal breasts, as quantified via a combination metric yielding a p-value ~ 0.0006.
fractal characterization of microcalcification clusters from mammography
The fractal nature of cancer has become a widely accepted concept in recent years. Using a wavelet-based method to detect microcalcifications (MC) in breast tissue seen in mammograms we have characterized the fractal geometry of benign and malignant MC clusters from two separate 2D projected mammographic views of the same breast, i.e. the cranial-caudal (CC) and mediolateral-oblique (MLO) views. Through a Bayesian analysis, we showed that with 95% credibility, the probability that fractal breast lesions are malignant is between 74% and 98%, and the probability that Euclidean breast lesions are benign is between 76% and 96%. This supports the notion that the fractal structure of malignant tumors is more likely associated with an invasive behavior into the surrounding tissue compared to the non-invasive Euclidean structure of benign tumors.
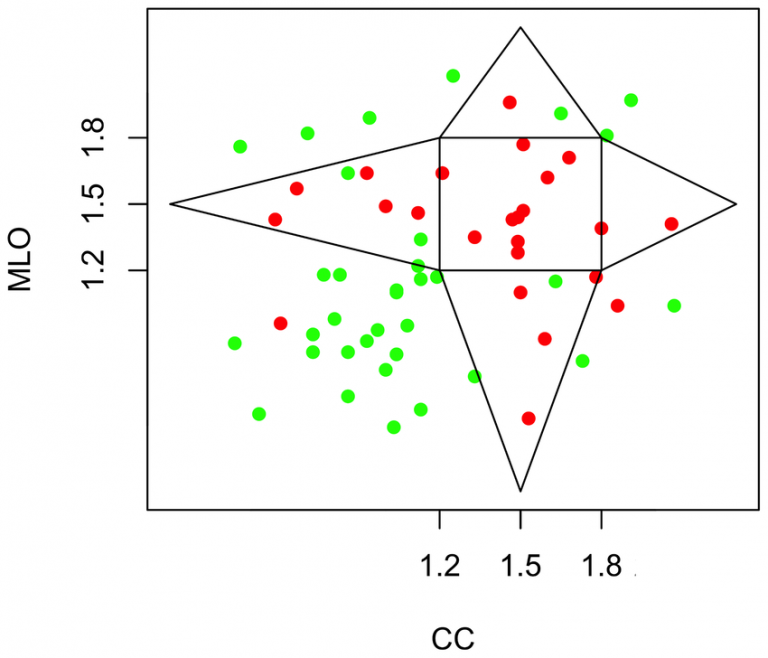
Fractal dimension obtained from the MLO view as a function of the fractal dimension obtained from the CC view. A polygonal region is outlined, the inside of which is defined as the “fractal zone” while the outside as the “Euclidean zone”. Cancer = red and benign = green.
simulated microcalcifications in breast tissue
CompuMAINE identified that the Hurst exponent, H, which quantifies the global roughness of the image density fluctuations, can distinguish between varying tissue densities found in the breast. CompuMAINE software simulated growth of microcalcifications in tissues of varying roughness and analyzed the fractal dimension and morphology of the simulated microcalcifications. This agent-based model showed the effects of tissue structure on microcalcification morphology.
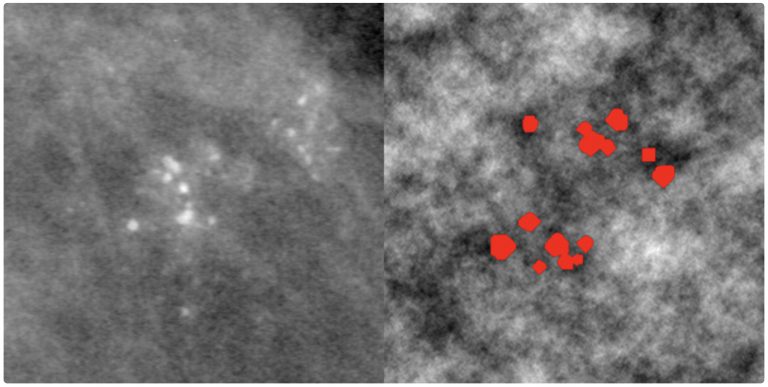
The left image shows cluster microcalcification in breast tissue, with the right showing simulated cluster microcalcification.
characterization of seizure morphology and frequency variation in genetic models of absence epilepsy
Nearly a third of people diagnosed with epilepsy do not respond to current anti-seizure medications, and those who respond often suffer from drug-related side effects. CompuMAINE scientists developed a computational tool to detect spike-wave discharges (SWDs), an indicator of absence seizures. Wavelet-based analysis of electroencephalogram (EEG) signals revealed unusual harmonic patterns in the power spectra of EEG absence seizure signals. These unique characteristics were used to automatically detect SWDs.
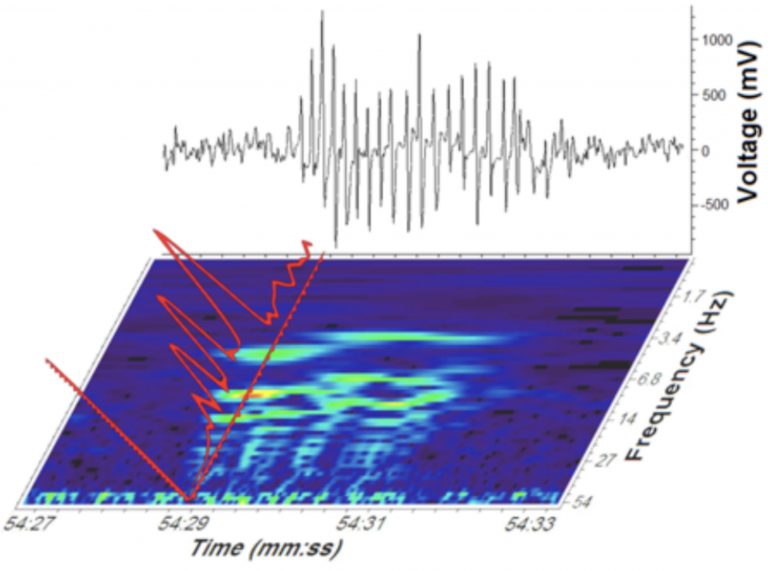
Time and frequency plots of the EEG are correlated with voltage to create a power spectrum harmonics. These data are used to extract SWDs from the original EEG signal and subsequently identify absence seizures.
characterization of chromosome territory morphology
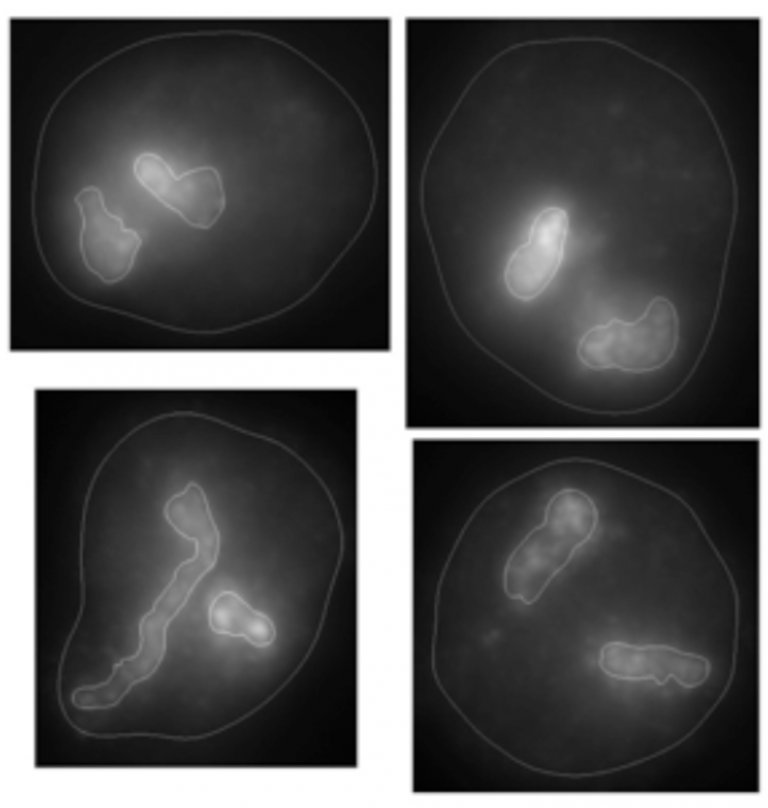
Examples of wavelet-based segmentation of mouse chromosomes 1 (left) and 12 (right) indicating irregular shape of chromosomes.
While it is known that chromosome territory (CT) size and gene density influence positioning, the relationship between CT shape and positioning is poorly understood. CompuMAINE scientists developed a novel 2D methodology to automatically segment and detect subtle differences in sub-nuclear architecture. It was shown that mouse interphase CTs have highly nonspherical morphology and that CT positioning is nonrandom and favors heterologous CT groupings.
The same technology was used to find CT neighborhoods in mouse lymphocytes. DNA breaks were induced in these cells via radiation. It was determined that inter-CT distances directly relate to translocation partner choice in these cells.
structure and organization of chromosomes in huntington’s disease
While the genetic basis of Huntington’s disease (HD) was discovered in 1993, the exact mechanism of the disease’s progression is still unknown. Cells from individuals with early HD, individuals with moderate HD, and a control group were stained using florescence markers and imaged. These images were then analyzed and segmented using a combination of machine learning and specialized thresholding algorithms. Measurable changes in the structure and organization of chromosomes were identified. These changes in chromosome structure and organization could potentially provide a new avenue for diagnosis and treatment.
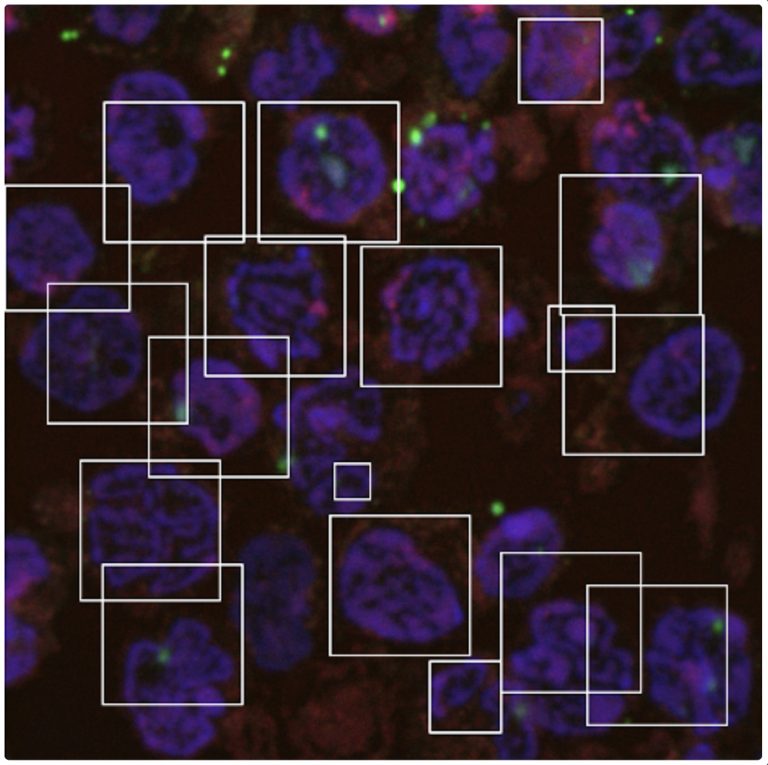
A machine-learning algorithm detects and segments nuclei in a Huntington’s disease sample.
detection and quantification of nuclear architecture in c. elegans
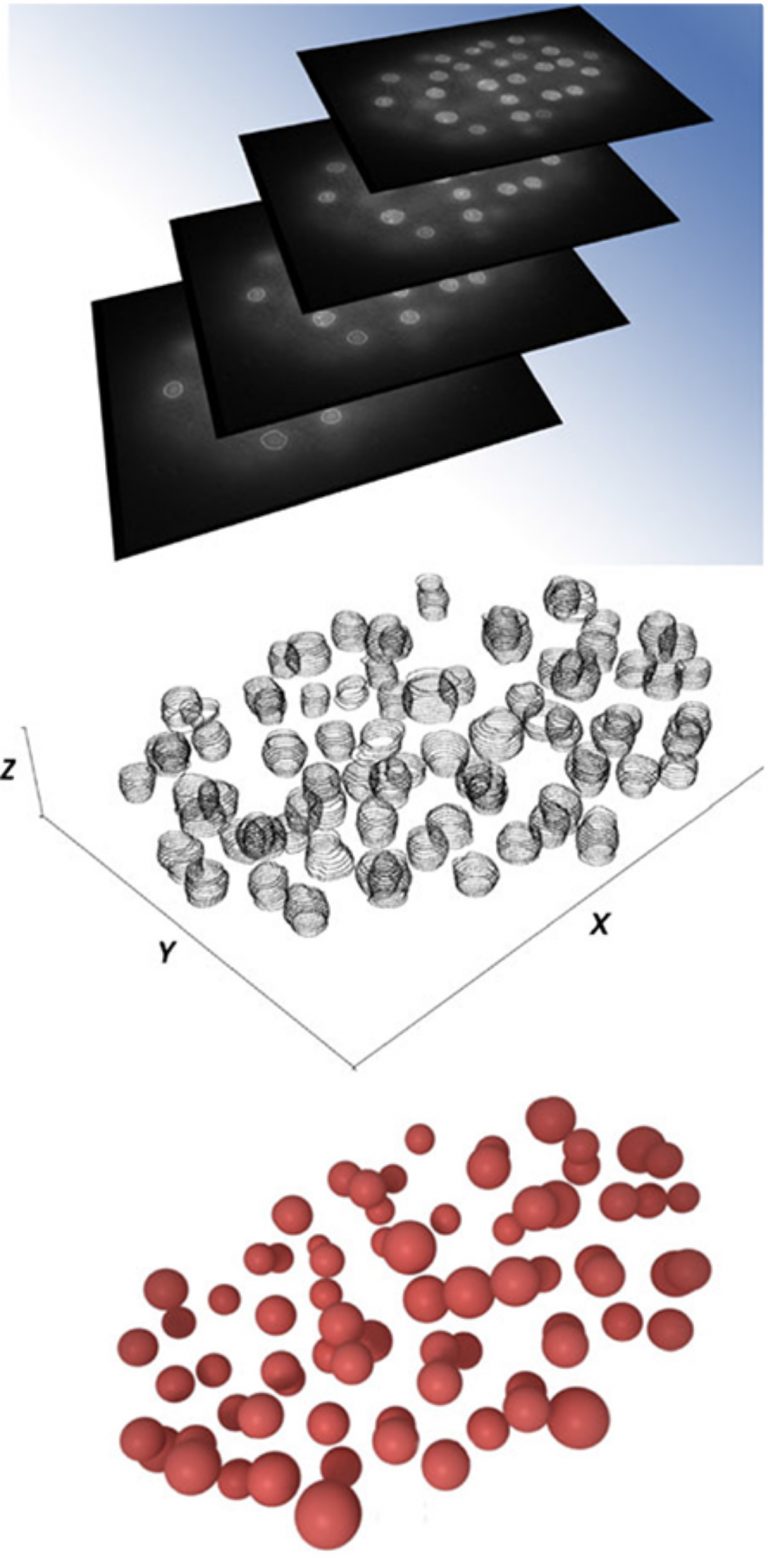
The top image shows the individual xy cross-sections of embryonic nuclei. The middle image shows the wavelet-segmented cross-sections stacked in z-plane. The bottom image shows 3D reconstruction of embryonic nuclei.
Specific nuclear domains are nonrandomly positioned within nuclear space, and this preferential positioning plays an important role in genome activity and stability. CompuMAINE scientists characterized intranuclear positioning of Caenorhabditis elegans HPL-2, which is a marker for heterochromatin domains in developing embryos.
CompuMAINE used a wavelet-based automatic segmentation method to isolate nuclei from images of C. elegans embryos. These nuclei were then analyzed for fluorescence intensity, which indicated positions of HPL-2.
Characterization of chromosome territory morphology and intermingling
There is currently a large gap in the tumor cytological analyses where observer bias deeply influences interpretation of signals and changes in cell intra-and extra-nuclear morphology, positioning, and overall organization. CompuMAINE developed a novel 3D methodology that automatically segments and detects subtle differences in sub-nuclear architecture. This method potentially can be used to score images of nuclei for pathological changes.
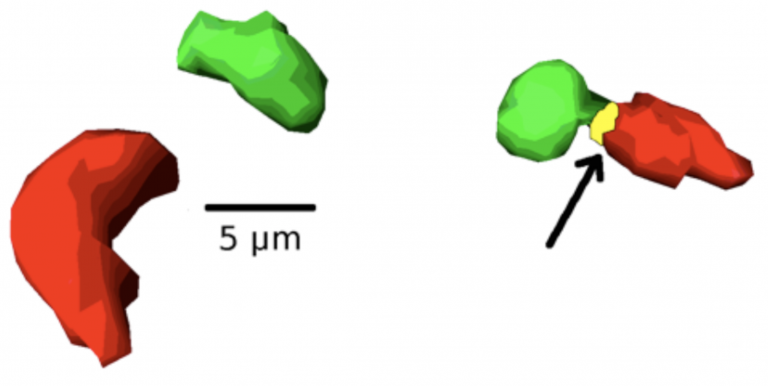
The left depicts a 3D representation of two chromosome territories. The right contains a 3D representation of overlapping chromosome territories. The yellow area is the site of chromosome intermingling.
fractal properties of pascal’s triangle modulo primes

Developing theoretical ideas based on numerical investigations of the fractal properties of Pascal’s Triangle.
Pascal’s triangle modulo a prime number yields an infinite array of numbers that display interesting fractal properties. One way to quantitatively describe these fractal patterns is via the so-called box-counting dimension. Two CompuMAINE students (Matt Potter and Elliot Ossana) and collaborators Rob Niemeyer and David Bradley have teamed up with Dr. Khalil to work on this project. A paper is currently under peer review at the journal Fractals.