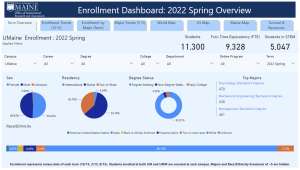
Updates to the Interactive Enrollment Dashboard and Resources

OIRA continues to expand our Interactive Data offerings with both public and internal dashboards.
Our Enrollment dashboard is the latest update to our public report offerings, which now include an in-depth view of fall, spring and summer terms. The term overview provides you a snapshot of enrollment data for one selected term. For a longitudinal view, the Enrollment Trends tab provides enrollment trends over the last 10 years. The dimension filter on the Enrollment Trends tab offers disaggregation by such demographics as age, sex, race/ethnicity, first-generation status, and more. The Enrollment by Major tab provides enrollment by major for a particular term, while the Major Trends tab offers enrollment trends by major over the last 5 years. Finally, with our new map feature you can see where our enrolled students resided before coming to UMaine using world, U.S., and Maine maps.
Filters are available to drill down into the data using a number of metrics: Campus (UM/UMM), Career (Undergraduate/Graduate), college, department, degree, plan with degree level, and Online Program. Use the available buttons located on the left side to switch between visuals and tables for easy analysis.
Finally, visit the Power BI Resources page to find video and PDF tutorials, report guides, and tools for accessing Power BI dashboards.
