Figure 1

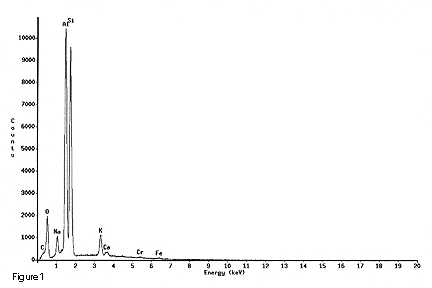
Figure 1. Spectrum from the energy dispersive X-ray test shot at 4000x on a flat, apparently clean spot between the shoulder blades. The C-spike represents carbon or any element with a lower atomic number, such as beryllium, since the apparatus could not distinguish between elements with atomic numbers lower than carbon. This is interpreted as “Be” in Table 1.

Hudson Museum, The University of Maine, A Member of the University of Maine System.
