Figure 2

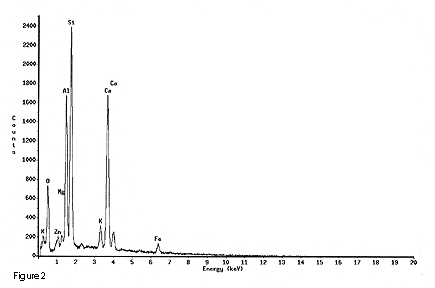
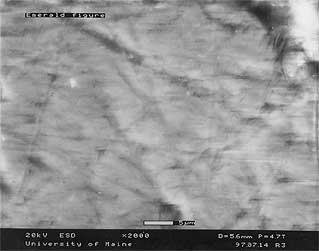
Figure 2. Spectrum from the energy dispersive X-ray test shot at 2000x on a flat, apparently clean spot on the right buttocks. The count (y-axis) is lower than that for Figure 1, which may be due to the different magnification of the test.

Hudson Museum, The University of Maine, A Member of the University of Maine System
