Vulnerability Analysis
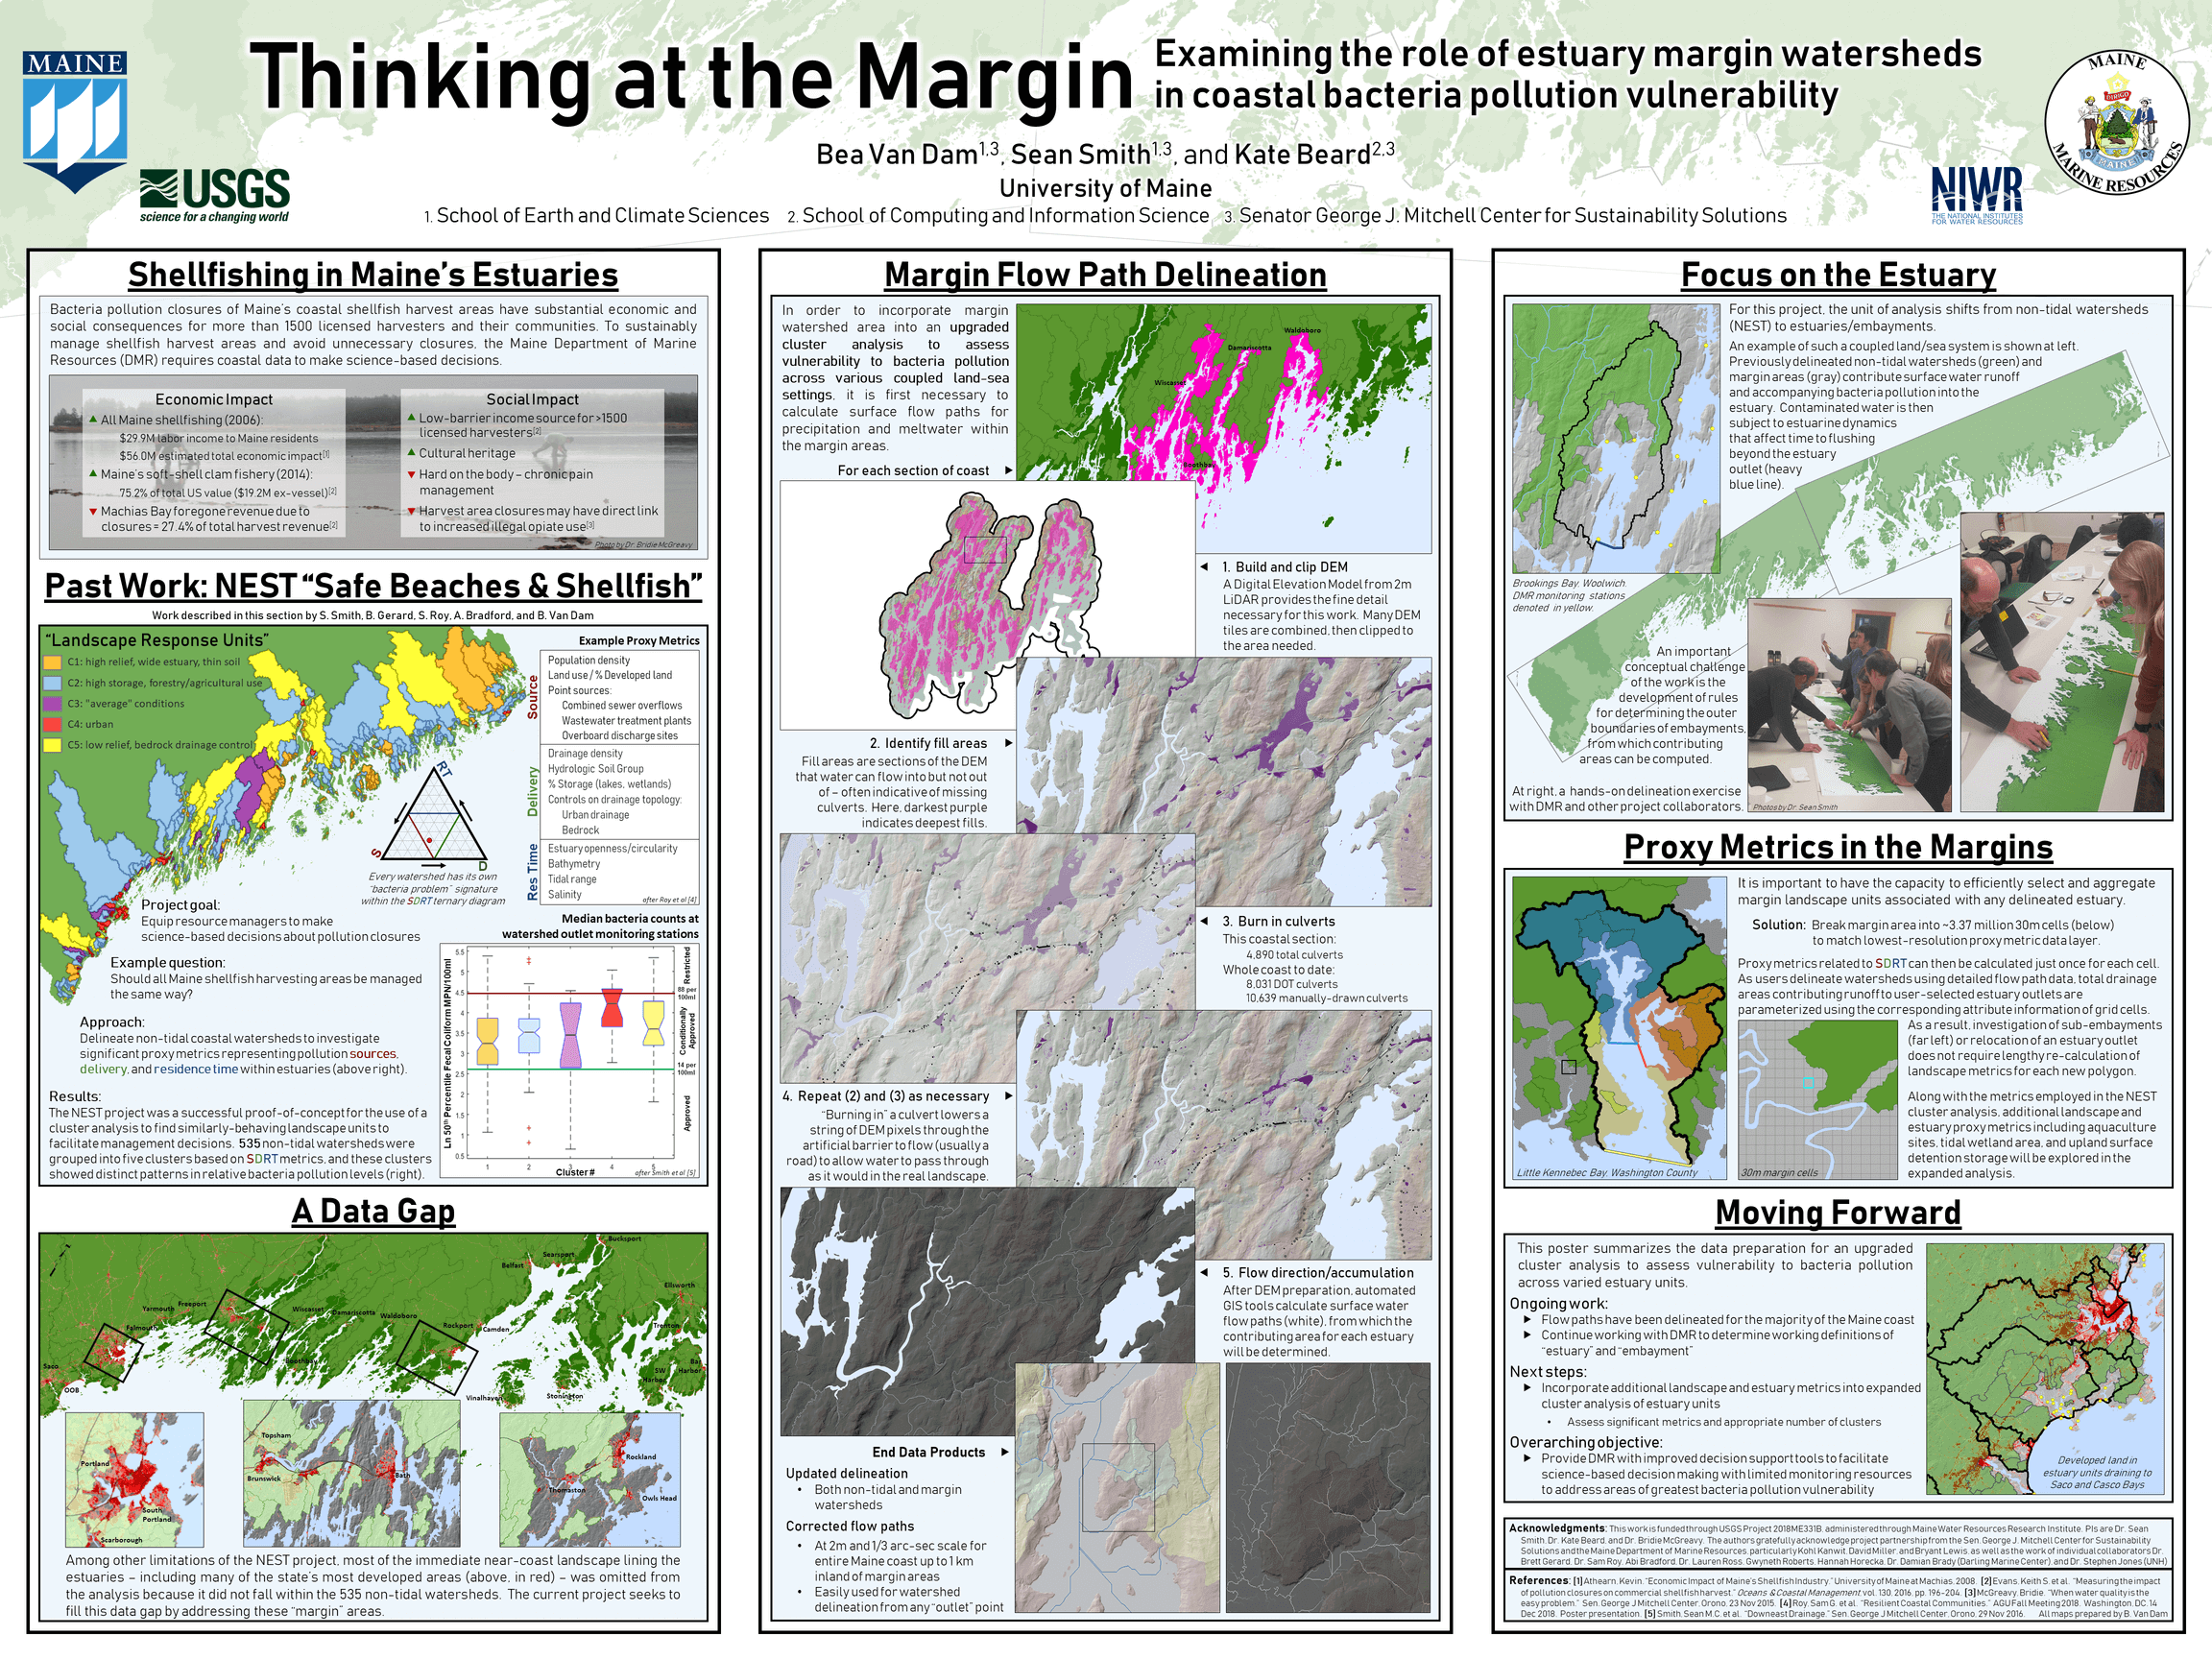
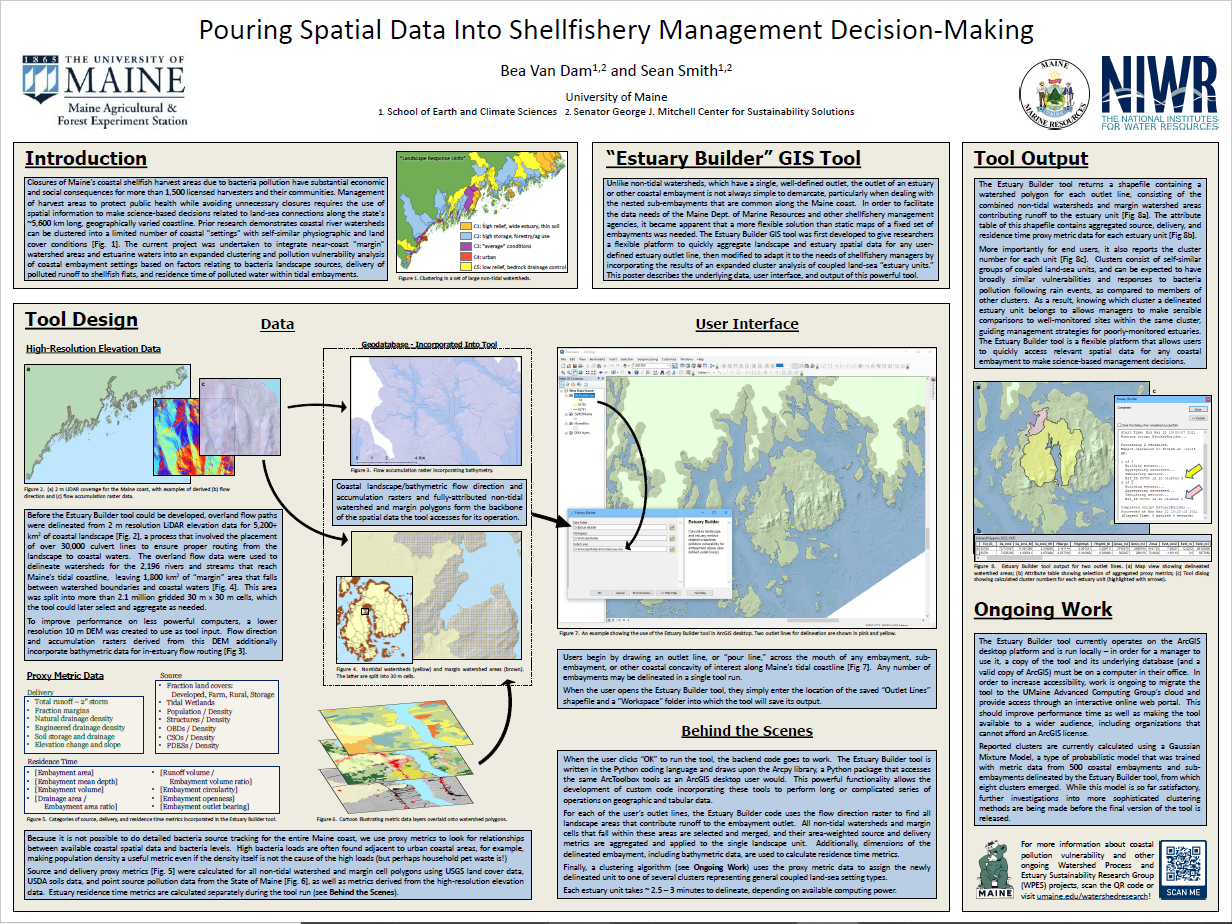
In order to effectively fulfill the mission of managing the health of Maine’s shellfisheries, the Maine Department of Marine Resources requires adequate data and support tools to make scientifically-informed decisions about temporary closures in response to harmful coastal bacteria pollution events. To facilitate data-driven management decisions surrounding closure and re-opening of shellfish flats, School of Earth and Climate Sciences PhD student Bea Van Dam and her advisor Sean Smith have undertaken a full-coast bacteria pollution vulnerability analysis, using spatial data to investigate how proxy metrics related to bacteria sources, delivery from the landscape to coastal waters, and residence time in estuaries and embayments interplay to affect vulnerability to bacteria pollution in different coastal settings.
Project Background
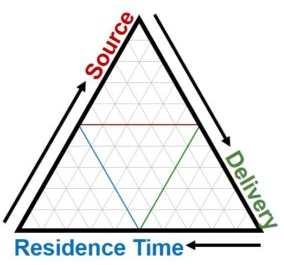
The Maine Department of Marine Resources (DMR) is tasked with ensuring the safety of the state’s valuable and extensive estuarine shellfisheries against such health threats as fecal coliform bacteria pollution. These bacteria and other pollutants are washed from the landscape during precipitation events and carried to via stream networks and surface flow to coastal waters, where they accumulate in clams and other filter feeders and can cause sickness in consumers of harvested shellfish. To mitigate these threats, shellfish managers temporarily close mudflats after large rain events, but this in turn negatively impacts the livelihoods of harvesters and their communities. In order to keep temporary closure lengths to the minimum required to ensure consumer safety, it is vital for shellfish managers to understand how various coastal settings differ in their vulnerability to bacteria pollution events, which is driven by differences in bacteria sources on the landscape, delivery from landscape to coastal waters (i.e. runoff generation and drainage networks), and residence time within the estuaries before flushing out to sea (Figure 1).
Prior research approached this question by assessing source-, delivery-, and residence time-related proxy metrics for 535 stream and river watersheds draining to Maine’s tidal coastline and finding clusters of watersheds with similar characteristics. This limited set of clusters, or “landscape response units,” allowed DMR to leverage limited monitoring capacity by applying knowledge gained from well-monitored locations to make informed management decisions in other harvesting areas within the same cluster.
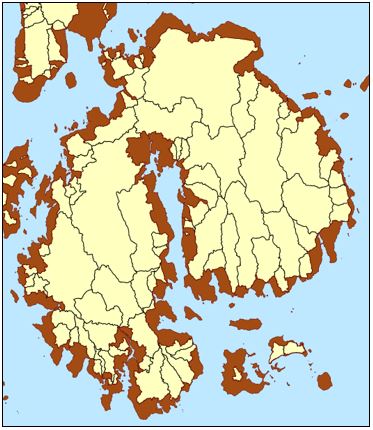
Certain data gaps were identified during the course of the initial proof-of-concept research, including the omission of much of the near-shore landscape from the analysis. The deltas of land between non-tidal watershed outlets, which we are referring to as “Margin Watershed Areas” (MWAs or “margins”), do not support perennial stream networks but instead contribute runoff directly as overland flow (Figure 2). These areas comprise a total of ~1,800 km2 of Maine’s coastal landscape and include parts of some of the state’s most densely populated cities and towns, including the entirety of the Portland peninsula. This project began with the specific goal of incorporating these margin areas into an expanded vulnerability analysis, where the unit of analysis also shifts from the non-tidal watershed (river mouth) to the entire coupled landscape-estuary system (“estuary unit”).
Data Assembly
The first stage of this project required the delineation of surface flow paths for the length of Maine’s coastline in order to incorporate the margin areas with the original 535 non-tidal watershed polygons and update the borders of those polygons where new elevation data had become available. Delineation occurred over a total of 5,236 km2 of coastal land area and involved the placement of over 30,000 culvert lines to ensure proper flow routing across the 2 m resolution LiDAR bare earth digital elevation models (DEMs). This stage resulted in the creation of 12 output data layers (hydro-enforced bare earth and hillshade DEMs at 2 m and 1/3 arcsecond resolutions, culvert polylines, flow direction and flow accumulation rasters at 2 m and 1/3 arcsecond resolutions, and stream polylines based on 0.05, 0.20, and 0.30 km2 area to channel initiation) to feed into both the vulnerability analysis and any future modeling needs.
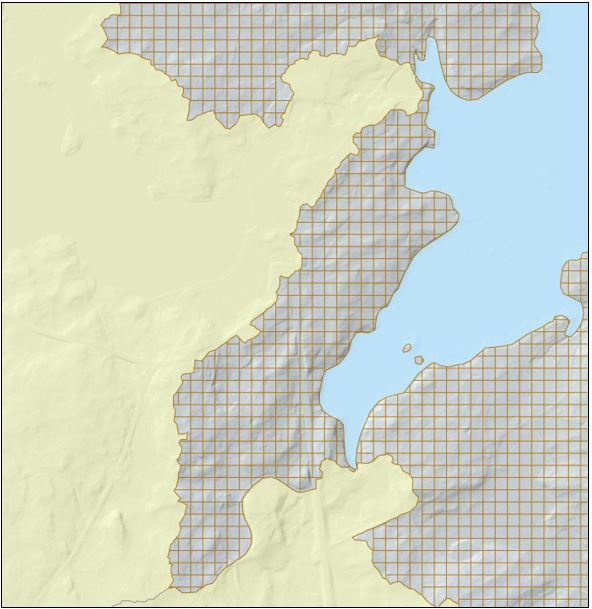
These data were used in conjunction with National Hydrography Dataset (NHD) stream lines to determine the placement of stream and river outlets along the length of the coast. Outlets were placed at the closest flow accumulation line to their “official” NHD counterparts. Due to the densification of the NHD stream layer in the intervening years, the number of non-tidal watershed polygons increased from 535 to 2,196, with the additional watersheds falling within area that had originally been considered margins. The remaining 1,800 km2 of margin area was split into a grid of 30 m x 30 m polygon cells to accommodate calculation of proxy metrics (Figure 3).
In the second stage of data assembly, existing spatial data layers were overlaid on the landscape polygons to calculate metrics related to bacteria sources, including land cover, population / density, and point source sites such as overboard discharge and combined sewer overflow sites; and delivery, including soil types and storage capacity, surface slope, and natural and engineered drainage density. Where appropriate, metrics were additionally broken into whole-watershed and margin-only subcategories. When combined with in-estuary residence time metrics (next section), each delineated estuary unit is described by a total of 107 columns of metric data.
Estuary Delineation GIS Tool
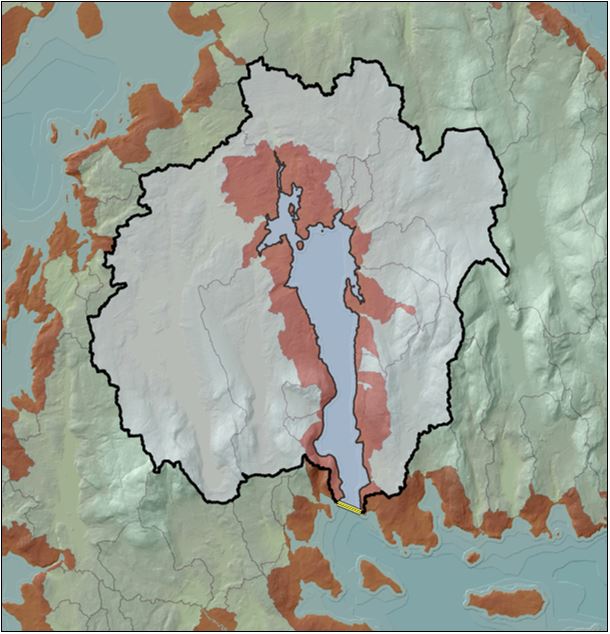
Rather than provide DMR with a static map of a limited number of delineated estuaries, the decision was made to build a flexible tool that would allow users to draw an outlet line across any coastal embayment or sub-embayment and see source, delivery, and residence time metric data for that coupled land-sea unit. The ArcGIS tool, written in Python, incorporates the previously developed flow direction and flow accumulation data layers and uses those to delineate the contributing landscape and embayment area above each outlet line. All non-tidal watershed polygons and margin cells that fall within this area are selected, and their source and delivery time metrics are aggregated into landscape-wide totals. Next, the delineated embayment is used to calculate residence time related metrics, including embayment circularity and the ratio of landscape runoff volume to embayment volume for a 2” rainfall event. The tool returns a polygon and metric attribute table for each estuary unit, and since the clustering exercise (next section) it has been updated to also calculate cluster membership for each newly delineated unit.
Clustering and Vulnerability Analysis
500 tidal embayments and sub-embayments along the length of Maine’s coast were delineated with the ArcGIS tool to feed into a cluster analysis, to find “types” of coastal settings. It is expected that members of the same cluster will exhibit broadly similar landscape and estuarine responses to precipitation events, allowing DMR to transfer knowledge and management strategies from well-monitored sites to others in the same cluster. For the preliminary cluster analysis, the data were standardized (each column centered by subtracting the mean and scaled to unit variance), then a principal component analysis was performed to reduce the dimensionality of the dataset from 107 metrics to 18 principal components, which explained just over 80% of variance in the data. Clustering was then performed on the principal component dataset using a Gaussian mixture model (GMM) with full variance. Since the GMM requires the user to specify the number of clusters, testing was done for k=4 through k=15 with 100,000 initializations for each k , and 8 was found to be the optimum number based on the Bayesian Information Criterion. The optimum model was then integrated back into the GIS tool to allow newly delineated estuary units to be assigned to a cluster. Explorations of more sophisticated clustering methods for the data are ongoing.
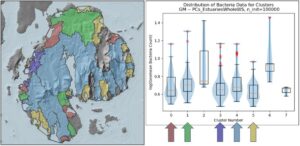
480 of the 500 delineated embayments contain one or more DMR bacteria monitoring sites. Data from these sites will be used to perform a vulnerability analysis on the final clusters to determine whether certain types of coastal settings are more vulnerable to high bacteria loads than others and assess the tightness of the spread within each cluster, which will inform DMR management approaches. Early analysis of bacteria loads in the preliminary clusters indicates there may be some measure of equifinality at play – some clusters may have roughly similar median bacteria levels but for different reasons, for example, high source loads in one cluster vs high residence times in another, which would require different management responses (Figure 5). A full vulnerability analysis will be performed once clustering is finalized.