Estuary Hydrodynamic Modeling
Residence time of waterborne bacteria and other pollutants in estuaries and bays – how long the pollution remains in the area before being flushed out to sea by freshwater flow and tidal cycles – is a key factor in the vulnerability of those estuaries to pollution problems. Department of Civil and Environmental Engineering PhD student Taylor Bailey and her advisor Lauren Ross are developing detailed hydrodynamic models of the bays and estuaries surrounding Mount Desert Island to help understand how residence times differ within and among these interconnected bodies of water.
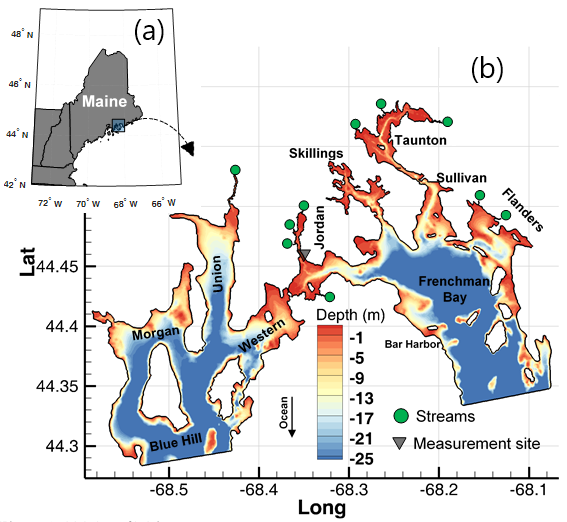
The flow in Frenchman-Blue Hill Bay systems is simulated using Telemac3D model, an integrated finite element tool for free surface flow simulation (Hervouet, 2007; Moulinec et al., 2011). The model domain extends from (44.24o N, 68.52o W) to (44.24o N, 68.52o W) covering the entire Blue Hill Bay and Frenchman Bay as well as the adjacent (sub) estuaries as portrayed in Figure 1b. The model is forced by realistic tides at the two ocean boundaries (based on the local tidal solution TPXO database (Egbert & Erofeeva, 2002)) and streamflow from 10 rivers (green circles in Figure 1b). The model domain is discretized by an unstructured mesh with resolution ranges from 250 m (near the ocean boundary) to 1.0 m (near the rivers) in the horizontal plane and 15 terrine-following layers in the vertical plane.
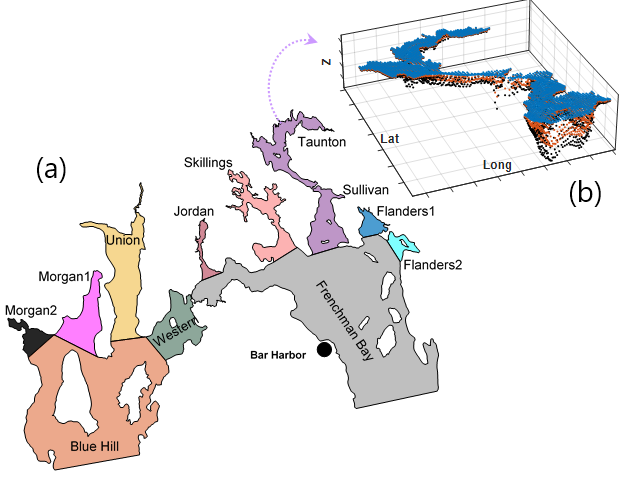
The modeled Frenchman-Blue Hill Bay system is divided into 11 sub-regions, created by delineating estuary mouths based on coastal morphology (Figure 2a). Within each sub-region, Lagrangian particles are released in three layers: near the surface, mid water depth, and near the bottom (Figure 2b). A total of 100,000 particles are released across the entire tomain. A unique identifying number is assigned to each particle so it can be tracked (Animation 1). Particles are color-coded based on the region in which they were released to observe the exchange of water masses among estuaries (Animation 2). By tracking the particles, residence time and flushing time are quantified for each region. The particles are passive (do not affect the dynamic of the flow), conservative (do not die or reproduce), and neutrally buoyant (they can move in three dimensions based on the current direction). Work is currently underway to expand the model domain to cover more area, including Somes Sound on the south end of Mount Desert Island, and to include freshwater input from additional small and medium streams.
![]()
Poster on coastal transport timescales and connectivity
Citations
Egbert, G. D., & Erofeeva, S. Y. (2002). Efficient inverse modeling of barotropic ocean tides. Journal of Atmospheric and Oceanic Technology, 19(2), 183–204.
Hervouet, J.-M. (2007). Hydrodynamics of free surface flows: modelling with the finite element method. John Wiley & Sons.
Moulinec, C., Denis, C., Pham, C.-T., Rougé, D., Hervouet, J.-M., Razafindrakoto, E., et al. (2011). TELEMAC: An efficient hydrodynamics suite for massively parallel architectures. Computers & Fluids (Vol. 51). Elsevier.