Revealing Deepwater Lobster Settlement Across Thermal Gradients in the Gulf of Maine
Funding Sources: NOAA, Maine Sea Grant & Ready Seafood Co.
Investigators:
Richard A. Wahle (University of Maine)
Kathleen Reardon (Maine Department of Marine Resources)
Industry Partners:
Curtis Brown (Ready Seafood Co., Portland, ME)
Jordan Druin (JJD Lobster Inc., Cutler, ME)
This science-industry partnership aims to evaluate the relationship between bottom temperature gradients and the depth-wise and alongshore distribution of newly settled and older juvenile lobster. We test the hypothesis that the recent, unprecedented surge in lobsters eastward and deeper in the Gulf of Maine has been driven by a warming ocean.
Vessel-deployed lobster postlarval collectors will be deployed in a random stratified design in coordination with Maine DMR’s current ventless trap monitoring across 3 depth strata in the oceanographically contrasting east and west segments of Maine’s coast. The paired sampling approach will enable us to evaluate the influence of temperature gradients on the nursery potential of the seabed for new settlers and movements by older lobsters.
The project aligns with Sea Grant’s priority of sustainable seafood production by addressing the role of a warming ocean on the production of Maine’s most valuable fishery. It also provides fishery managers and coastal economies information they need to respond appropriately to the changing environment, as well as to forecast future trends.
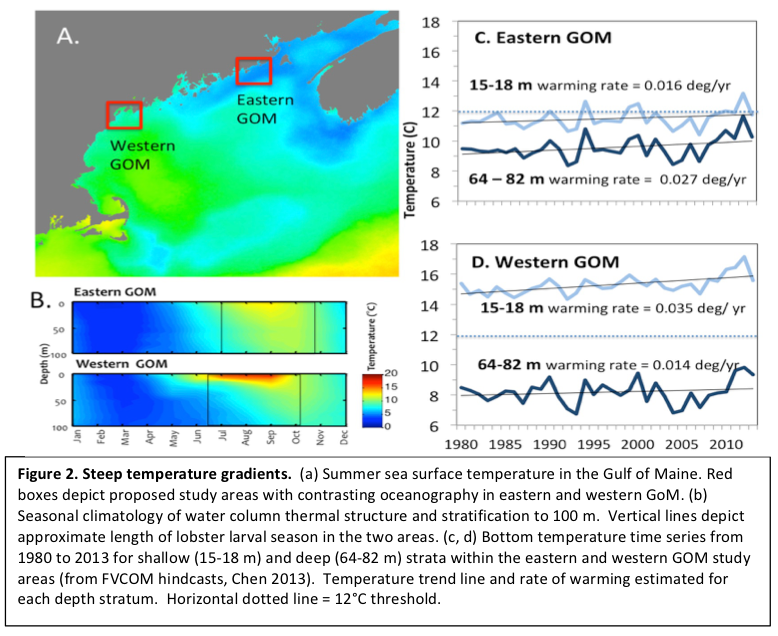
Image (above): Figure 2. Steep temperature gradients. (a) Summer seas surface temperatures in the Gulf of Maine (GoM). Red boxes depict proposed study areas with contrasting oceanography in eastern and western GoM. (b) Seasonal climatology of water column thermal structure and stratification to 100 m. Vertical lines depict approximate length of lobster larval season in the two areas. (c, d) Bottom temperature time series from 1980 to 2013 for shallow (15-18 m) and deep (64-82 m) strata within the eastern and western GoM study areas (from FVCOM hindcasts, Chen 2013). Temperature trend line an rate of warming estimated for each depth stratum. Horizontal dotted line = 12 degrees Celsius threshold.