High net loss of intertidal wetland coverage in a Maine estuary by year 2100
Jack McLachlan1
1Ecology and Environmental Sciences, University of Maine, Orono, ME.
ABSTRACT
Rising sea levels and coastal land use are predicted to synergistically impact coastal wetlands by reducing their extent and ecosystem functioning through a process known as “coastal squeeze”. Impervious surfaces associated with coastal development prevent the natural process of wetland migration, whereby intertidal wetland area is lost at its seaward edge to rising low water lines, but is replaced by eroding uplands and accumulating new wetland at its landward edge. As these constructed surfaces prevent the replacement of lost wetland, intertidal wetlands are “squeezed” by rising sea levels until they disappear. This study uses geographic information system (GIS) to predict changes in intertidal wetland position and losses due to coastal squeeze in a midcoast Maine estuary under a 2-m sea level rise scenario. Estimates range from a net loss of 28% to 57% in intertidal wetland coverage by year 2100. The lower end of this range includes some mitigation efforts like managed realignment projects. The disparity between the currently high area of intertidal wetlands and the available area for wetlands to migrate into maybe explained by local topography and artificially high sedimentation rates associated with historic land use.

1. Introduction
Global sea levels are expected to rise by as much as 2 m by the year 2100 as a result of anthropogenic climate change (Parris et al. 2012). The rate of sea level rise (SLR) will accelerate as global temperatures continue to increase at an accelerating rate, driving oceanic thermal expansion and ice sheet meltwater runoff. A sea level rise of 2 m (henceforth SLR2) is the highest scenario predicted by the 2012 US National Climate Assessment (Parris et al. 2012). However, a recent probabilistic reanalysis of sea level rise in the twentieth century found that most future scenarios have underestimated the acceleration of historic SLR (Hay et al. 2015).
The Gulf of Maine is warming faster than 99% of the rest of the world’s oceans (Fernandez et al. 2015), with the International Panel on Climate Change predicting a 1.7-2.8°C increase in annual temperatures across Maine by the year 2050. The last time temperatures increased by 2°C, during the last interglacial period, sea levels in the North Atlantic rose by 4-6m (Jansen et al. 2007). Thus, SLR2 by the year 2100 could be a conservative estimate for the Gulf of Maine (Fernandez et al. 2015).
1.1 Impact of SLR on estuarine wetlands
Estuaries are expected to be severely affected by SLR, as their ecosystem functions are contingent on a balance of freshwater inputs and tidal hydrological processes (Morris et al. 2002). Tidal wetlands that fringe estuaries are important for coastal defense by attenuating wave energy during large storm surges. These wetlands provide other important ecosystem services, such as providing nursery habitat for valuable fisheries, supporting local pollinators and biodiversity, sequestering carbon, and ameliorating agricultural and industrial runoff to estuaries.
The lands surrounding estuaries are often of high real estate value, either for industrial, residential, or recreational purposes. These areas are then often flanked by artificial coastal defenses, such as sea-walls or dykes. These impervious surfaces and hard coastal defenses prevent the natural landward migration of tidal wetlands with rising sea levels, whereby intertidal wetland area is lost at its seaward edge with SLR, but is replaced by eroding uplands and accreting sediments at its landward edge. Hard constructed surfaces prevent the replacement and overall migration of tidal wetlands, causing wetlands to be “squeezed” between the rising low water line and coastal defense structures. Coastal squeeze can also occur along coastlines that have steep changes in elevation, or where the slope of the land is too great for wetlands to migrate up into (Pontee 2013).
Here I use Maine elevation, land cover, and sea level rise data to predict how wetlands might respond to a sea level rise of 2 m in a large estuary in midcoast Maine. By investigating local land cover and geography, I model the migration of intertidal wetlands and show that the extent wetland coverage would decline due to coastal squeeze processes in the SLR2 scenario.
2. Methods
2.1 Study Region
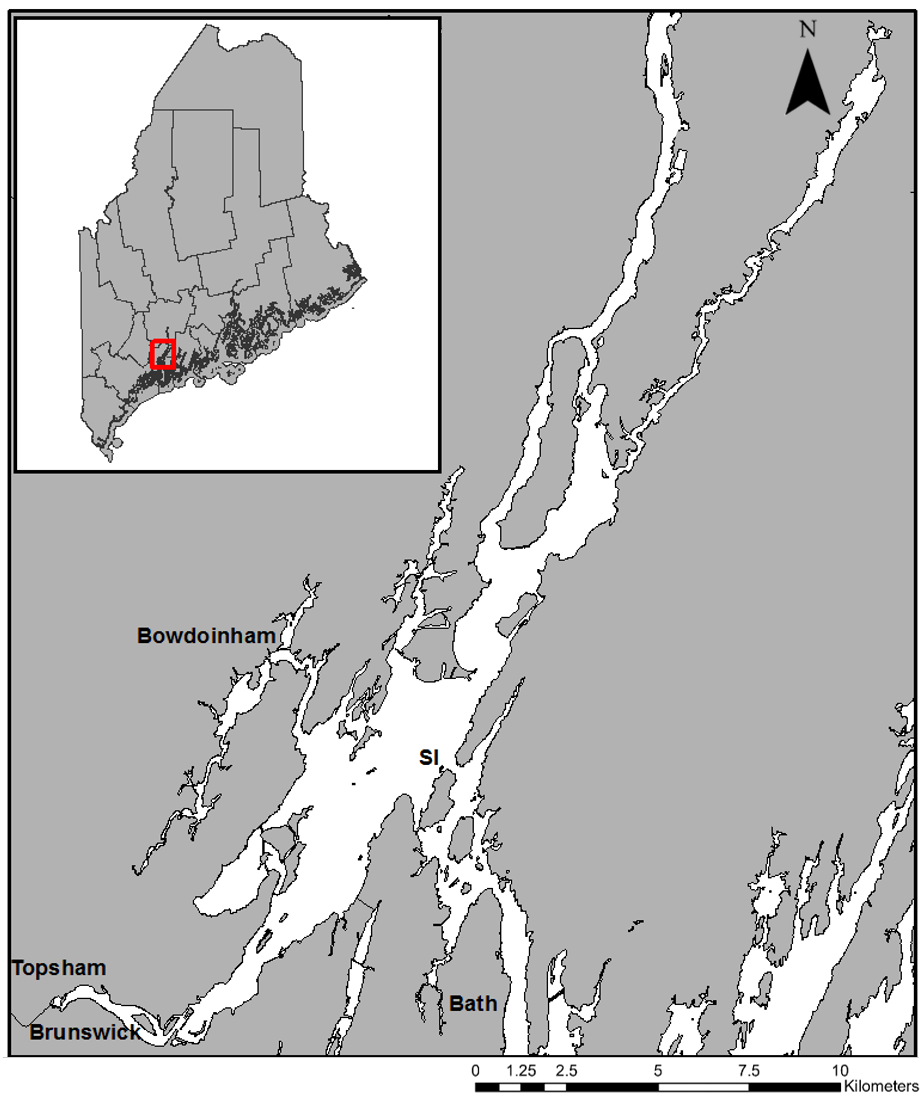
Merrymeeting Bay is a confluence of six rivers that collectively drain one third of the freshwater in the state of Maine and forms the upper portion of the Kennebec Estuary (Lichter et al. 2006). Much of Merrymeeting Bay’s 4000 ha are vegetated and its subtidal areas are shallow, with depths averaging 2 m (Lichter et al. 2006). Merrymeeting Bay is the largest tidal freshwater estuary north of the Chesapeake. Its intertidal wetlands are the largest staging ground for migratory waterfowl in the northeastern US, and it’s the only area of wetland in which all of Maine’s migratory fish species can be found (BWH 2017). The study region includes Merrymeeting Bay – the large bay-like area and the tidal portions of the rivers that confluence therein sensu Lichter et al. (2006) – and some brackish sections of the lower Kennebec Estuary as far south as the Sagadahoc Bridge in Bath, ME (Figure 1).
2.2 Data Acquisition and Analyses
Geographical base layers for Maine were obtained from the Maine Office of GIS (MEGIS; http://www.maine.gov/megis/). Wetland data were obtained from the National Wetlands Inventory (NWI) database (https://www.fws.gov/wetlands/). Additional data on vernal pool locations (not included in the NWI) were obtained from MEGIS. A digital elevation model (DEM) (10m2 pixel-size) for the area was provided by C. Loftin. Land cover data for the study area were taken from the 2004 Maine Land Cover Database (MELCD) obtained from MEGIS. Annual tide information and tidal datums were taken from National Oceanographic and Atmospheric Administration (2015). Summarized information on data sources and formats is provided in Table 1.

Unless otherwise noted, ArcMap 10.3 (Environmental Systems Research Institute, Redlands, CA) was used for all data visualization and analyses. All data were imported into ArcMap and were reprojected, when appropriate, to the same projected coordinate system (NAD1983 UTM Zone 19N). The DEM raster data had a pixel size of 10 m2 and so all other raster data were resampled to the same pixel size. All data were clipped to the extent of the study region (Figure 1).
2.2.1 Tidal wetland coverage
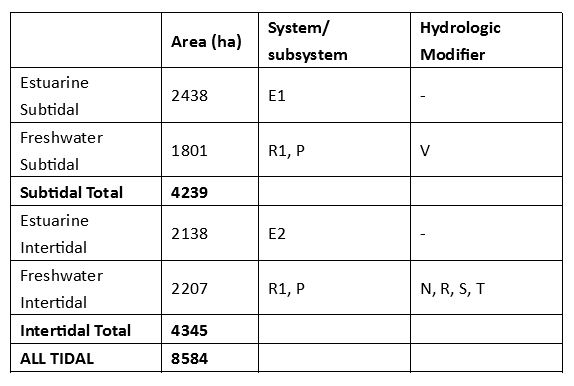
The current extent of tidal wetlands for the study area was established by selecting polygons from the NWI dataset based on their Cowardin wetland classification codes and hydrologic modifiers. Total wetland area was calculated for estuarine: subtidal and intertidal, and for freshwater: subtidal and intertidal. Full descriptions of hydrological systems and modifiers are available in Cowardin et al. (1979).
2.2.2 Coastal wetland coverage
State ordinances that dictate coastal development zoning in Maine commonly define coastal wetlands as the tidal and subtidal lands below the upper limit of the highest annual high tide (HAT). HATs are calculated by the National Ocean Service for tidal stations along the U.S. coast. For this project, the published 2015 HAT for Sturgeon Island, Merrymeeting Bay ((43° 58’ 50.04” N, 69° 50’ 4.64” W; NOAA 2015) was used to define the current extent of coastal wetlands – 0.762 m above the North American Vertical Datum of 1988 (NAVD88). The DEM used the National Geodetic Vertical Datum of 1929 (NGVD29) for reference. VDatum v3.4 (National Oceanic and Atmospheric Administration, Silver Spring, MD) was used to convert the HAT value for Sturgeon Island, ME from NAVD88 to NGVD29 to match the DEM, which resulted in a revised HAT value of 0.970 m. This value was used in these analyses.
2.2.3 Simulating SLR2
The following procedures loosely follow those of Torio and Chmura (2013) and simulate SLR2 above the current HAT:
-
- Defining current coastal wetland extent: To define the current extent and area of coastal wetland in the study region, values below 0.970 m in elevation in the digital elevation model were coded as wetland and all other values being coded as upland. These data were named “current_wetland”.
- Defining inundated areas after SLR2: After subtracting 2 m from the digital elevation model, this process was repeated to define areas that would be in inundated after SLR2 with values below 0.970 m in elevation being coded as wetland and all other values being coded as upland. These data were named “wetland_SLR2”.
- Quantifying potential novel wetlands and barriers to migration: A third dataset (“potential_marsh_migration”) was generated by overlaying the “current_wetland” and “wetland_SLR2” data. If pixels in the two datasets were different (upland and wetland) then a value of “1” was assigned to them. If the pixels were the same (wetland and wetland, or upland and upland) a zero value was assigned. Zero values were removed, leaving the areas that are currently uplands or non-tidal wetlands, but would potentially become tidal wetlands after SLR2. This “potential_marsh_migration” dataset was converted to vector polygons, and then the geoprocessing function Erase was used to remove areas that are currently classified as tidally influenced wetland in the NWI. This produced a dataset that included only novel tidal wetlands (“novel_tidal_wets”). Areas that are currently classified as non-tidal wetlands were also erased to leave areas that are currently not wetlands of any type (uplands) that would potentially become tidal wetland areas after SLR. The Intersect tool was used to determine which currently non-tidal wetlands would be reached by high tides after SLR2.
To determine the net change of intertidal wetland to subtidal wetland, the subtidal (low water) line was approximated to be 1.358 m (the mean tidal range in Merrymeeting Bay [NOAA, 2015]) below the high tide line after SLR2. The predicted wetland area “wetland_SLR2” was multiplied by the original digital elevation model to create elevation data for the areas that would be inundated after SLR2. Pixels with values below 1.358 m were coded as “subtidal”, which approximated subtidal areas after SLR2. Then, a mask of wetland polygons that are currently classified as intertidal in the NWI was overlaid, which allowed an estimation of the area of intertidal wetlands that would become subtidal after SLR2.
Elevation data for the areas that were classified as novel tidal wetlands “novel_tidal_wets” were extracted from the original digital elevation model, and slope (in degrees) was calculated using the Spatial Analyst tool, Slope.
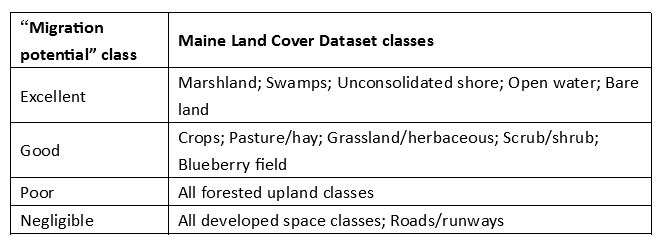
There were 22 land cover classes identified in the MELCD dataset for the study region. These 22 land cover types were reclassified into four groups based on their suitability for tidal wetland migration “Migration Potential” using a method adapted from Russell, Hawkins, and O’Neill (1997). The classification scheme used can be seen in Table 2.
3. Results
3.1 Current tidal wetland coverage
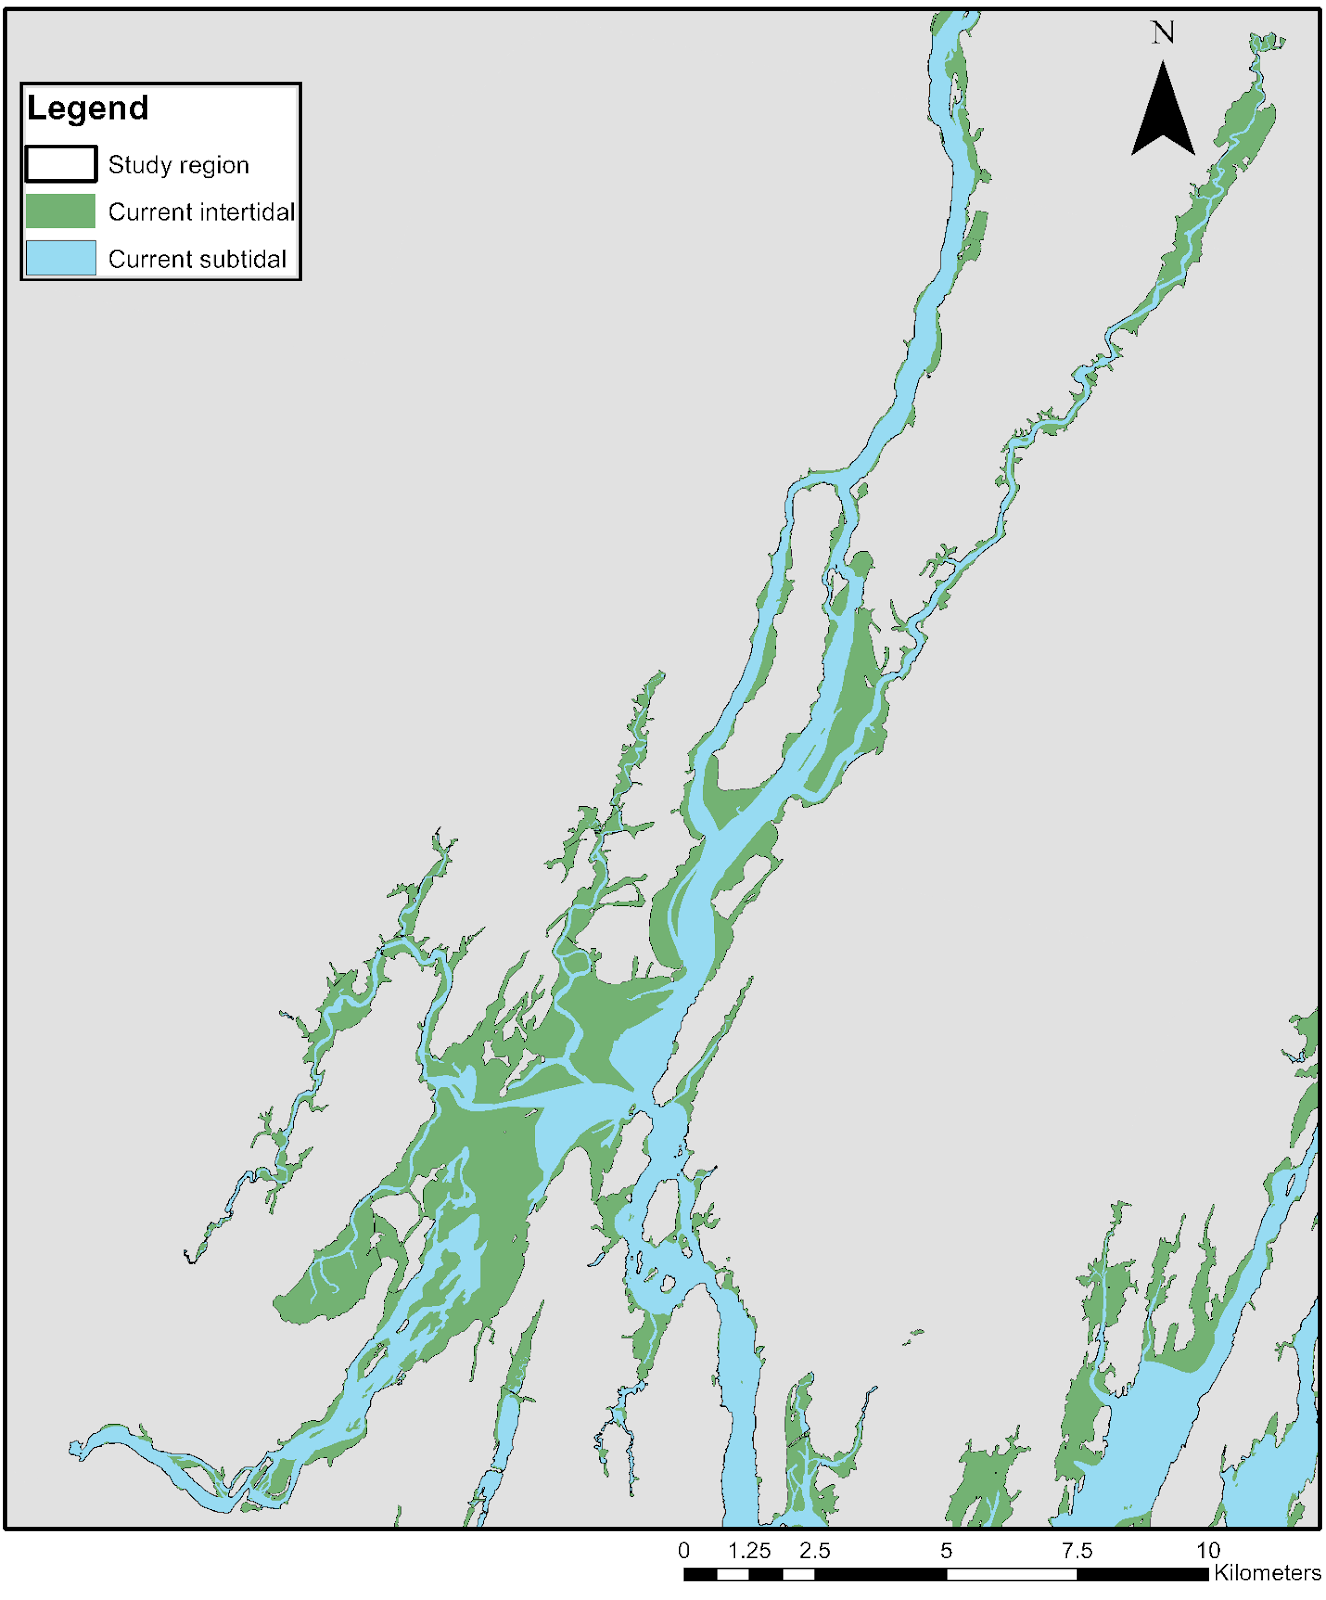
There were no NWI marine wetlands in the study region. The distribution of estuarine (brackish) and freshwater tidal wetlands closely corresponded to isohalines from previous salinity profiles for the Kennebec Estuary (Wong and Townsend 1999). Given that the geographical and hydrological conditions that create freshwater tidal areas are complex and difficult to model (Pasternack 2009), predictions of the limits of saline intrusion and relative changes in brackish and freshwater tidal wetlands are not covered in this study. Hence, estuarine and tidal freshwater wetlands were grouped by hydrology– subtidal or intertidal. Areas and geographic extent can be seen in Table 3 and Figure 2, respectively. Using the HAT definition, 6255 ha of the study region were classified as coastal wetland, 2329 ha less than those classified as tidal in the NWI.
3.2 Potential wetland coverage after SLR2
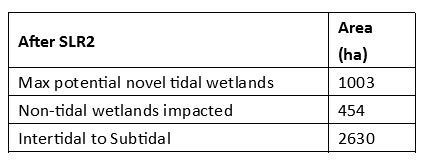
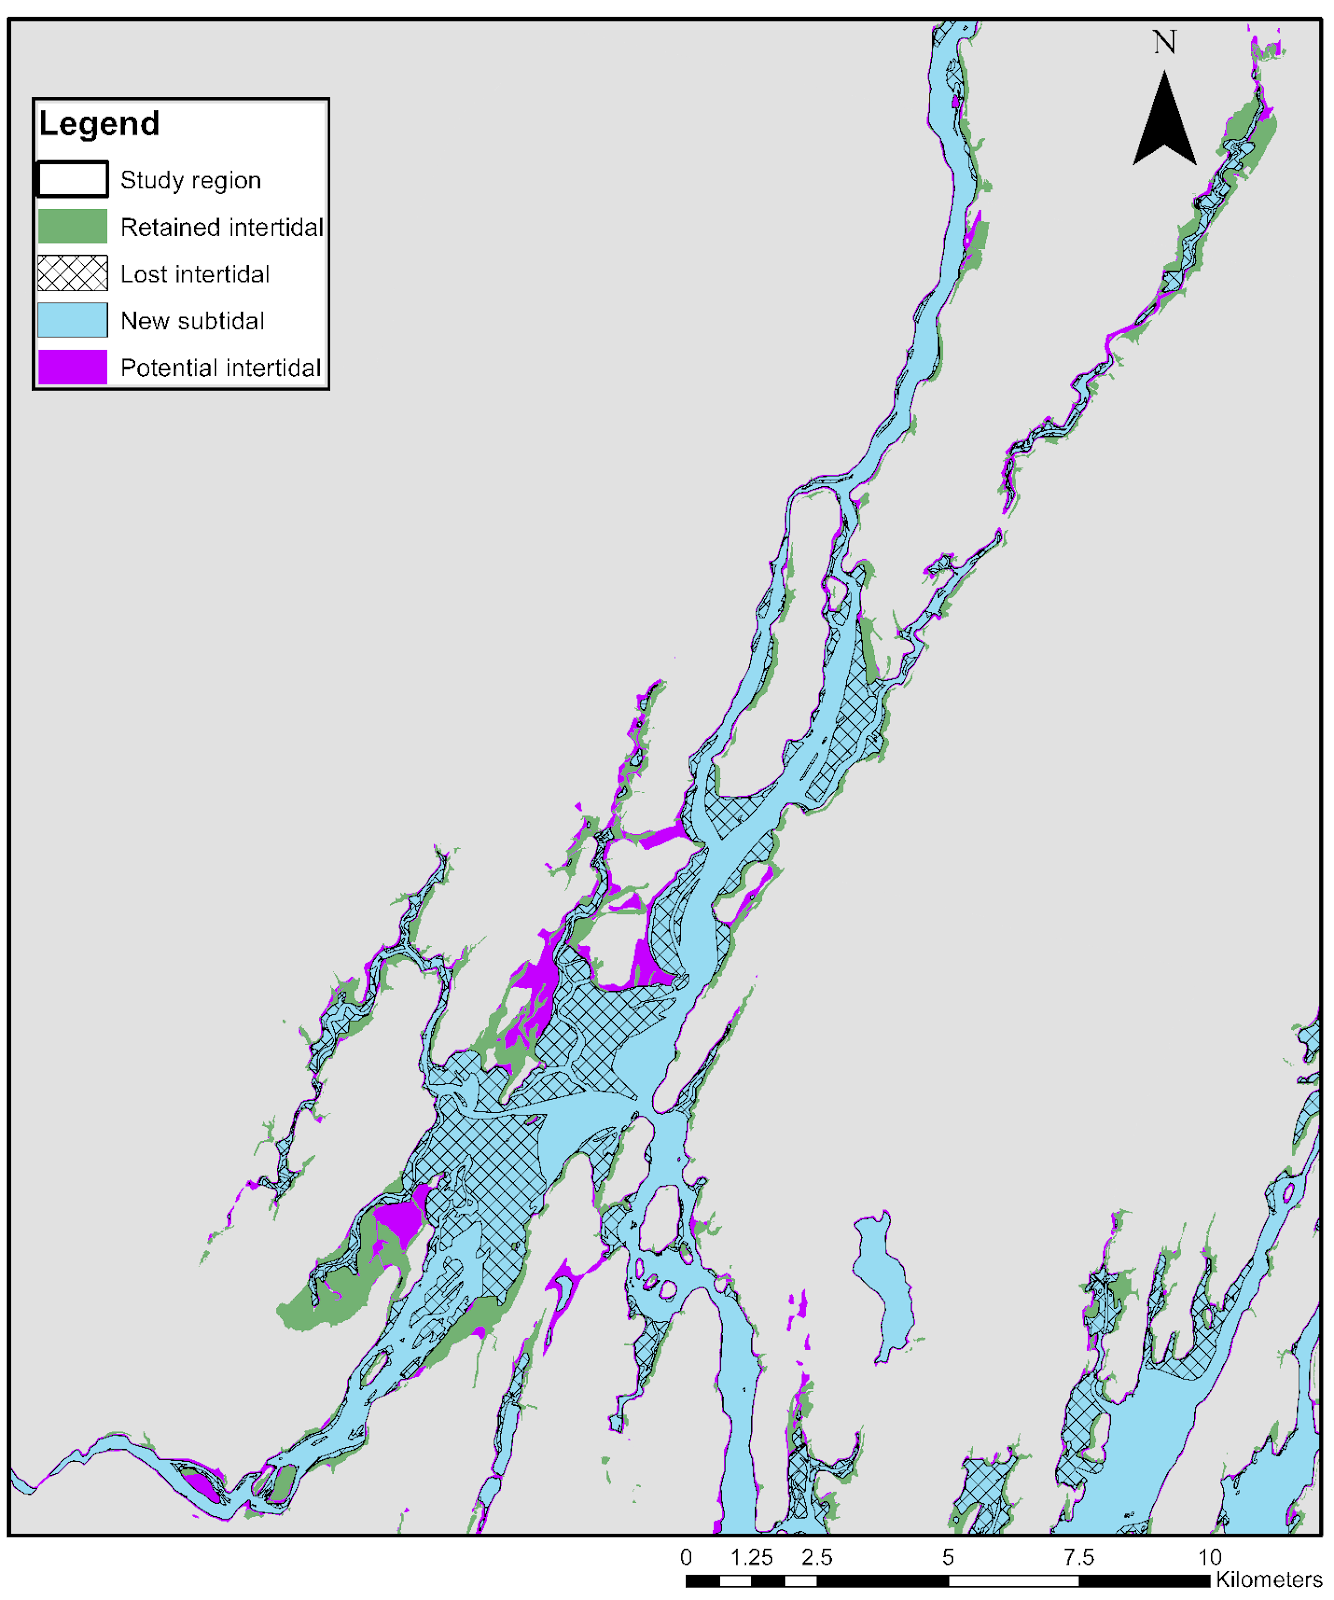
After simulating SLR2, 8928 ha was classified as coastal wetland. After correcting for differences between the NWI and HAT definitions, 1003 ha of the study region were predicted as the maximum area of novel tidal wetland (not currently tidal wetland under either definition). 454 ha of non-tidal wetlands and 1 vernal pool site were expected to be affected by SLR2 (Table 4). The predicted change from intertidal to subtidal wetlands was 2630 ha. See Figure 3 for changes in extent and affected areas.
3.3 Realized wetland coverage after SLR2
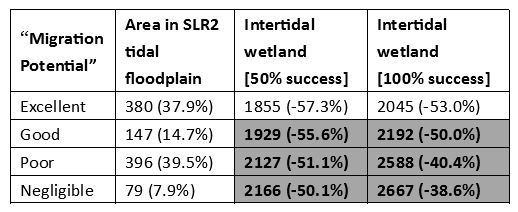
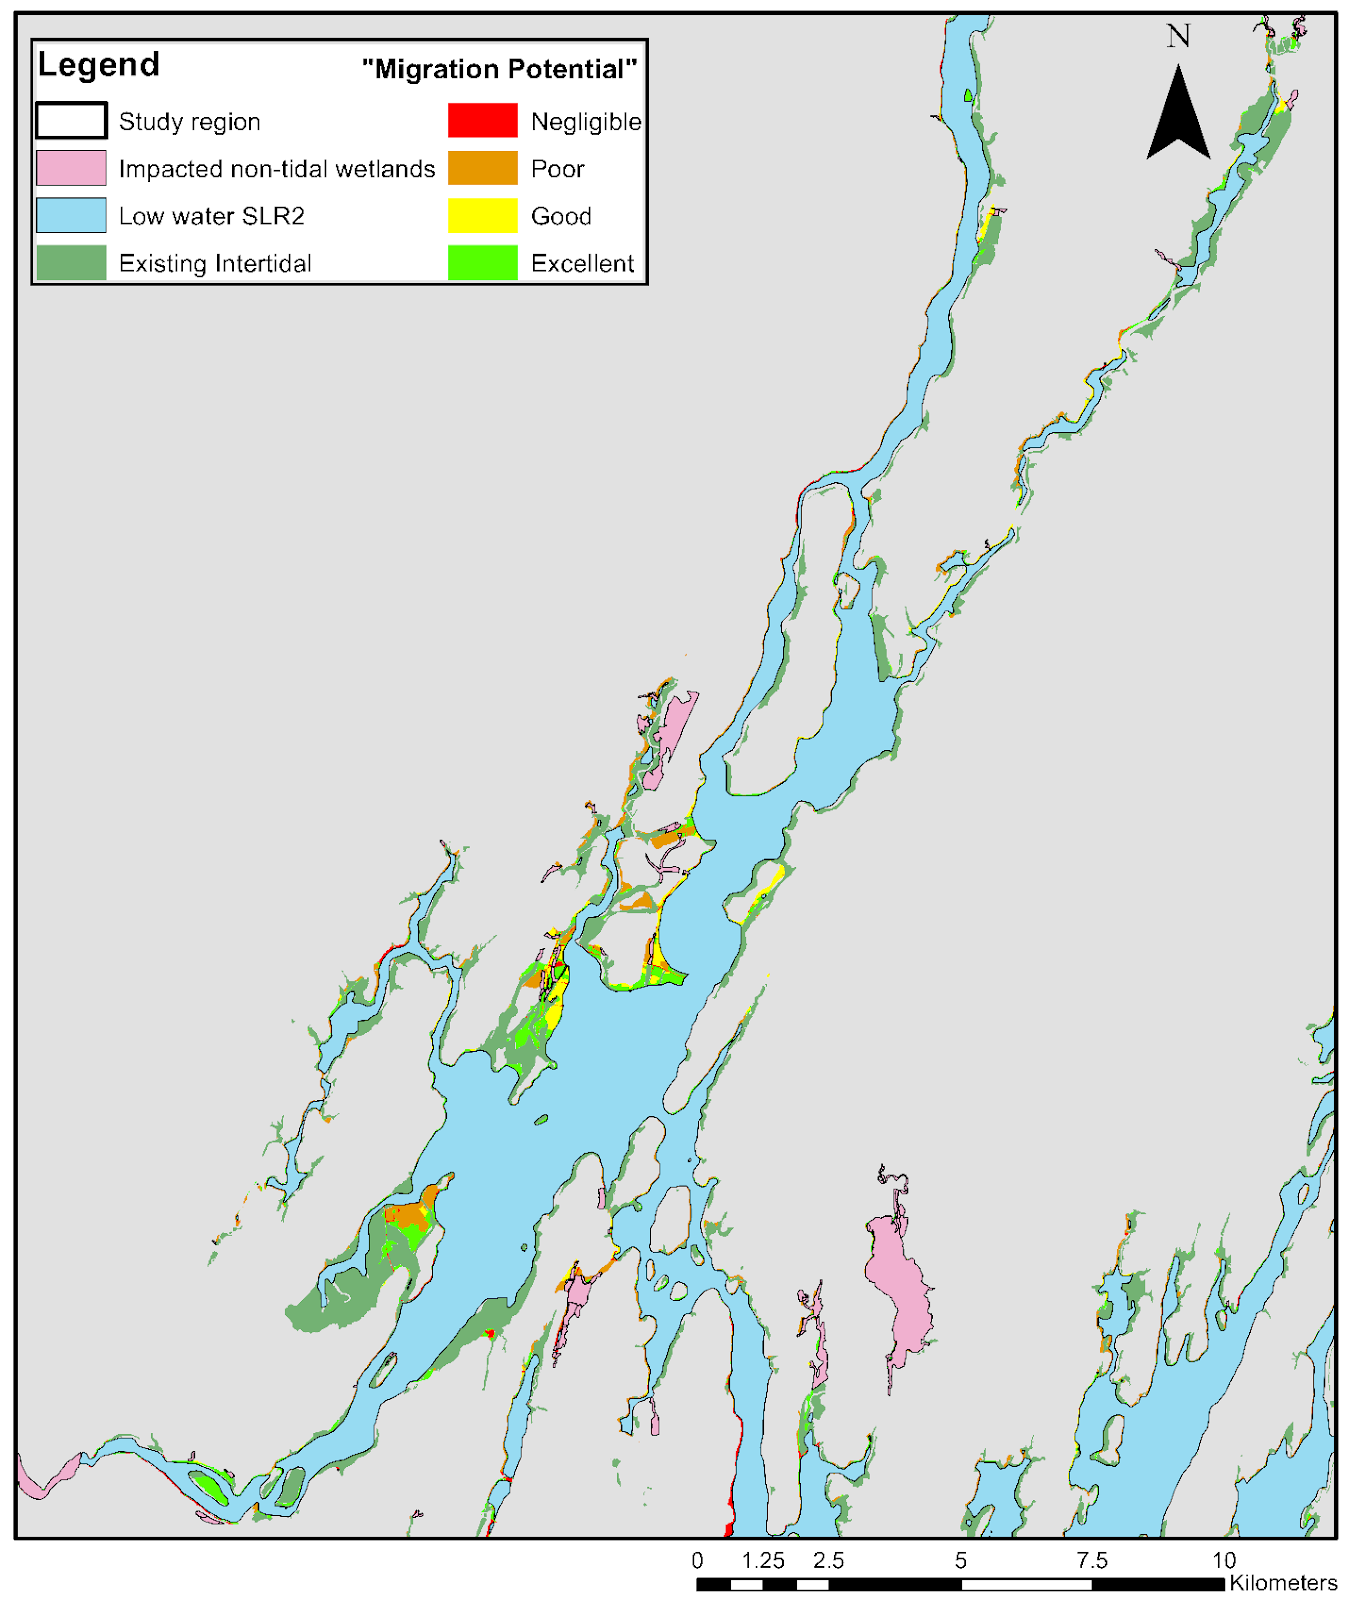
Slope values in the potential area for wetland migration (1003 ha) ranged between 0° and 5° (x̄ = 1.16 ± 0.003°). Around half (52.6%) of the wetland migration area was classified as having “Excellent” or “Good” migration potential in terms of existing land cover types (Table 5). Estimates for net realized total intertidal wetland coverage under different wetland migration success scenarios can be seen in Table 5. Figure 4 shows for the predicted geographic extent of each migration potential class.
4. Discussion
4.1 Wetland migration patterns
Merrymeeting Bay and surrounding areas currently have 4345 ha of intertidal wetlands, 60% of which (2630 ha) would be lost below the low tide line under the SLR2 scenario. This study predicts a maximum of 1003 ha of potential space for these intertidal wetlands to migrate into, based on land elevation alone. The SLR2 scenario used in this study was the highest predicted by the NOAA (Parris et al. 2012). As such, the predictions in this study for tidal wetland responses should represent one of the most extreme scenarios. Nevertheless, considering that recent reevaluations of SLR in the twentieth century have suggested that sea levels have been rising more rapidly than was previously predicted (Hay et al. 2015), and that the magnitude and frequency of storm-driven flooding has been increasing in the northeastern US and is expected to increase peak discharges of large rivers (Armstrong, Collins, and Snyder 2012), the findings of this study are not by any means implausible for the Merrymeeting Bay region. Moreover, this study doesn’t include any modeling of storm surges, which are also expected to become more frequent in Maine under climate change scenarios (Jacobson et al. 2009).
Even before barriers to wetland migration are included in the model, there would be a 38.6% reduction in the area of intertidal wetlands. There are two main classes of barriers to wetland migration: coastal development and creation of impervious surfaces; and natural steep changes in coastal elevation (Pontee 2013). Although the study region is relatively rural, around half (47.5%) of the area that wetlands could migrate into was ranked as being “Poor” or worse in terms of land cover using the definitions of (Russell et al. 1997).
It is unlikely that communities will want to (or be able to) convert the 79 ha of impervious land cover types (“Negligible” class) to wetland, as these areas include infrastructure and housing. “Managed realignment” is the process by which less valuable coastal land parcels are modified to create tidal wetlands and maximize the success of wetland migration, and has been used extensively in the UK and mainland Europe. This study identified 543 ha of land that is currently cropland or grassland (“Good”), and forested (“Poor”) that could be managed to promote tidal wetland formation. Even with Managed Realignment, natural migration in to land ranked as “excellent”, and currently non-tidal wetlands that will be reached by predicted high tides, there remains at least a 28% deficit in intertidal wetland coverage by 2100. Managed realignment may also have limited utility in the study region, as there are high monetary costs involved (beyond those associated with “losing” land to the water), which may outweigh the small increase in intertidal wetland area (Doody 2012).
4.2 Potential causes of the intertidal wetland “deficit”
While coastal development will play some role in preventing landward migration of intertidal wetlands in the study region, the relatively small area of land that will be inundated under a SLR2 scenario is the main contributor to the deficit in wetland coverage. Following Torio and Chmura’s (2013) methodology, slope was not found to be a significant impediment to wetland migration in this study region. Slope values were all below 5°, which is relatively shallow. Torio and Chmura (2013) suggest that slopes steeper than 11.5° would create a significant risk of coastal squeeze in Maine. It is likely that using a DEM with 10m2 pixels prohibited an accurate assessment of slope in the potential areas of wetland migration. While this assessment might have been possible with a 2m2 LiDAR-derived DEM, such a dataset was not available for this study.
The geography and environmental history of the study region could also explain the large deficit in intertidal coverage in the wetland migration scenario. The Kennebec estuary (and Merrymeeting Bay, by extension) is a “flooded river valley” estuary typical of northeastern North America (Belknap et al. 2002). It was likely deep prior to the arrival of European colonists. Historical references in Lichter et al. (2006) suggest that Merrymeeting Bay was deep enough for large ships to navigate as far as Brunswick until the mid-18th century, and Köster et al. (2007) found that sedimentation rates in Merrymeeting Bay were greatly elevated after the area became more densely settled after 1730 CE. This suggests that changing land cover and use, such as the conversion of forested land to agriculture, might have artificially elevated the extent of intertidal areas, as increased terrestrial erosion caused increase estuarine siltation.
Investigating patterns of land use change in the area around Merrymeeting Bay, Lichter et al. (2006) found that between 1956 and 1981, intertidal wetland area increased by 26 ha, but there has been no net change since, which the authors attribute to an increased afforestation of the surrounding watersheds. Changing land use and soil conservation practices may continue to reduce sedimentation rates in Merrymeeting Bay (sensu Meade 1982), which may exacerbate intertidal wetland loss due to SLR.
5. Conclusions
The tidal wetlands of Merrymeeting Bay and the Kennebec estuary are expected to be greatly affected by a 2-m rise in sea level. This analysis shows that coastal squeeze may cause a reduction in the area of intertidal wetlands by at least 28%. A reduction as large as 50% is likely due to topographical limits on wetland migration. Some modern non-tidal wetlands and vernal pools may become tidally influenced under this SLR scenario. However, their value in contributing to the overall area of intertidal wetland may be negated by the loss of their associated ecosystem functions and services. Targeted managed realignment projects in the area may mitigate some losses, but it is likely that the current extent of intertidal wetlands in Merrymeeting Bay has been artificially elevated by historic land use patterns, which may explain the high wetland “deficit” predicted values along a relatively rural coastline. While Merrymeeting Bay is an important conservation and recreation area, coastal management strategies should consider that the current extent of intertidal wetland may be a product of land use and disturbance, and intertidal wetland accretion may be slowing even in the absence of coastal squeeze processes.
Acknowledgements
I thank H. Greig, J. Haghkerdar, and the Sediment Ecology Research Group at the University of St Andrews for their support during the preparation of this manuscript. M. Correll, D. Hayes, and C. Loftin provided feedback on an earlier draft. I also thank C. Loftin for providing some of the data needed for this project. Comments by an anonymous reviewer greatly improved the manuscript.
REFERENCES
Armstrong, William H., Mathias J. Collins, and Noah P. Snyder. 2012. “Increased frequency of low-magnitude floods in New England.” Journal of the American Water Resources Association 48 (2):306-320.
Belknap, Daniel F., Joseph T. Kelley, and Allen M. Gontz. 2002. “Evolution of the glaciated shelf and coastline of the northern Gulf of Maine, USA.” Journal of Coastal Research SI 36:37-55.
BWH (Beginning with Habitat). 2017. Focus areas of statewide ecological significance. Kennebec Estuary. 9pp. Available at: https://www.maine.gov/dacf/mnap/focusarea/kennebec_estuary_focus_area.pdf Accessed: 4/1/2018
Cowardin, Lewis M., Virginia Carter, Francis C. Golet, and Edward T. LaRoe. 1979. Classification of wetlands and deepwater habitats of the United States. Washington, DC: U.S. Fish and Wildlife Service.
Doody, J. Patrick. 2012. “Coastal squeeze and managed realignment in southeast England, does it tell us anything about the future?” Ocean and Coastal Management 79:34-41.
Fernandez, I. J., C. V. Schmitt, S.D. Birkel, E. Stanicoff, A.J. Pershing, J.T. Kelley, J.A. Runge, G. L. Jacobson, and P. A. Mayewski. 2015. Maine’s Climate Future: 2015 Update. Orono, ME: University of Maine.
Hay, Carling C., Eric Morrow, Robert E. Kopp, and Jerry X. Mitrovica. 2015. “Probabilistic reanalysis of twentieth-century sea-level rise.” Nature 517 (7535):481-484. doi: 10.1038/nature14093.
Jacobson, G. L., I. J. Fernandez, P. A. Mayewski, and C. V. Schmitt. 2009. Maine’s Climate Future: An Initial Assessment. Orono, ME: University of Maine.
Köster, Dörte, John Lichter, Peter D. Lea, and Andrea Nurse. 2007. “Historical eutrophication in a river–estuary complex in mid-coast Maine.” Ecological Applications 17 (3):765-778. doi: 10.1890/06-0815.
Lichter, John, Heather Caron, Timothy S. Pasakarnis, Sarah L. Rodgers, Thomas S. Squires, and Charles S. Todd. 2006. “The ecological collapse and partial recovery of a freshwater tidal ecosystem.” Northeastern Naturalist 13 (2):153-178. doi: 10.1656/1092-6194(2006)13[153:TECAPR]2.0.CO;2.
Meade, Robert H. 1982. “Sources, sinks, and storage of river sediment in the Atlantic drainage of the United States.” The Journal of Geology 90 (3):235-252.
Morris, James T., P.V. Sundareshwar, Christopher T. Nietch, Bjorn Kjerfve, and D.R. Cahoon. 2002. “Responses of coastal wetlands to rising sea level.” Ecology 83 (10):2869-2877.
NOAA. 2015. Highest Annual Tide (HAT) Levels for Year 2015. Maine Coast from Eastport to Kittery.
Parris, Adam, Peter Bromirski, Virginia Burkett, Dan Cayan, Mary Culver, John Hall, Radley Horton, Kevin Knuuti, Richard Moss, Jayantha Obeysekera, Abby Sallenger, and Jeremy Weiss. 2012. Global sea level rise scenarios for the US National Climate Assessment. In NOAA Tech Memo OAR CPO-1.
Pasternack, Gregory B. 2009. “Hydrogeomorphology and sedimentation in tidal freshwater wetlands.” In Tidal Freshwater Wetlands, edited by Aat Barendregt, Dennis F. Whigham and Andrew H. Baldwin, 31-40. Leiden, NL: Backhuys.
Pontee, Nigel. 2013. “Defining coastal squeeze: a discussion.” Ocean and Coastal Management 84:204-207.
Russell, Gordon D., Charles P. Hawkins, and Michael P. O’Neill. 1997. “The role of GIS in selecting sites for riparian restoration based on hydrology and land use.” Restoration Ecology 5 (4S):56-68.
Torio, Dante D., and Gail L. Chmura. 2013. “Assessing coastal squeeze of tidal wetlands.” Journal of Coastal Research 29 (5):1049-1061.
Wong, Ming Wah, and David W. Townsend. 1999. “Phytoplankton and hydrography of the Kennebec estuary, Maine, USA.” Marine Ecology Progress Series 178:133-144. doi: 10.3354/meps178133.