Interact with Data Using Power BI
OIRA now offers self-service data through interactive data dashboards.
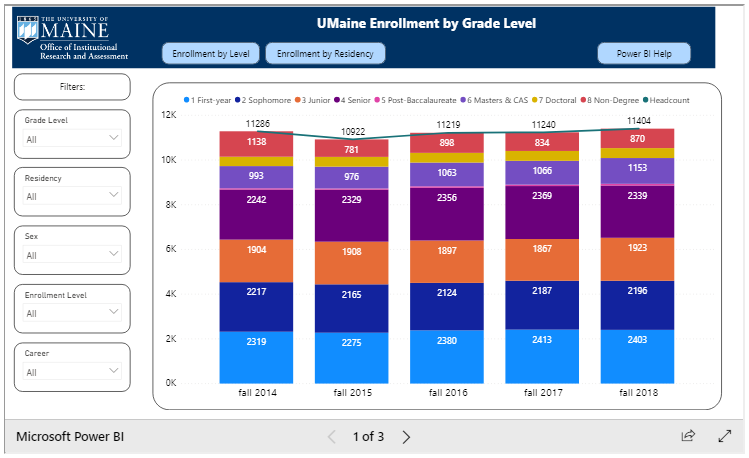
The Office of Institutional Research and Assessment now offers a new self-service interactive data page! In addition to providing our standard static reports, we now offer the ability to drill-down further into the data. Each dashboard includes a collection of charts on the respective topic. The buttons at the top of the dashboard allow you to select the metrics and the filters on the left side provide drill-down options.
We are happy to introduce the first three data dashboards available now:
- Undergraduate Admissions Data
- Graduate Admissions Data
- Enrollment Data
To access our new interactive data dashboards:
Navigate to https://umaine.edu/oira/reporting/interactive-data/
We will be using Microsoft’s Power BI, and have put together a useful Power BI quick start guide (pdf) to interacting with the dashboards on our website. Look for future dashboard updates in our newsletter!
Coming soon!
- Retention and Graduation Rates Data
- Degrees Conferred Data
- Student Credit Hours Offered by Academic Unit
- Customized password protected dashboards