Processing software
The ac-meter Data Processing Software processes data collected with a WETLabs ac-S In-Situ Spectrophotometer (ac-9 will be included in a future release). The intended audience of the software is members of the optical oceanography community looking for standardized, extensible, maintainable software to process their data with. The goal of having a standard data processing code is to ensure uniformity in the processing of data submitted to SeaBASS.
The goal for this software project was to create a usable, modifiable, community software package with a long lifespan that would change and grow with researcher’s needs, but not be dependent long-term on any one individual. Therefore, the code is publicly available on the online code repository GitHub at the following address/URL: https://github.com/OceanOptics/ACCode.
Description
The AC Data Processing Software has been written in Matlab and takes Level 1 (one step above ‘raw’) data from an AC-meter and processes it to a set of standards determined by the workshop held at the Bigelow Labs, Maine on March 13, 2015. A future version of the code will be written in (ported to) Python. The software is a rewrite of existing Matlab procedural code used to process in-line AC data collected to date. The existing code was typically shared by physically transferring code between users (with pieces of codes contributed by W. Slade, G. Dall’Olmo, T. Leeuw, E. Boss, and W. Neary). Cutting and pasting working sections of code into new code mostly facilitated reuse or commenting in/out sections of code as needed. A few functions were used, but most of the logic was contained in a single procedural file. QA and QC were performed visually by (E. Boss and W. Neary).
The current AC Data Processing software has a flexible and extensible design, allowing for future changes to be made without breaking the old code. Additional processing can be added at each processing step. This flexible design is built on a series of procedural Matlab scripts, which in turn calls object-oriented Matlab code. The combination of objects and scripts/functions provides the reusability and extensibility required of a project of this scope. There are only a few steps to set up a new project, documented in the software README.txt, on GitHub.
The AC Data Processing software runs in Matlab on both Windows and OSX, on a standard current desktop/laptop system.
Software Overview
The software is divided into four sections: Ingest, Pre-processing, Processing, and Output (Fig. 1). The Ingest phase reads in all the necessary data files for processing. The Pre-processing phase separates the total from filtered data, preparing it for the processing phase. The Processing phase applies the main processing rules to the data. The Output phase creates the data files necessary for SeaBASS submission, as well as any desired plots.
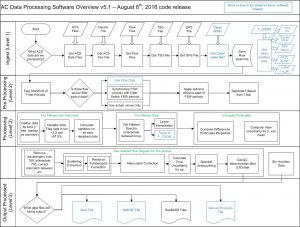
Ingest
The software stores data processing parameters from the user in a text-based .ini file, allowing different for customization. All the necessary data files (ac-meter data files, device files, etc.) to process ac-meter data are ingested, allowing for differences in file formats or file availability. It is flexible enough to allow for new file types to be added, such as those for post-processing (F_CDOM, HPLC, etc.)
Pre-Processing
The data is processed by first differencing the filtered from total data. The software automatically identifies the start and end of each filtered/unfiltered period. Users decide to either use the valve on/off data or detects the transitions automatically within the data itself. The transitions between filtered/unfiltered can also be manually edited and saved. Once the transitions have been identified and checked, the data is ready for separation into ‘total’ and ‘filtered’ data sets and for “Processing”.
Processing
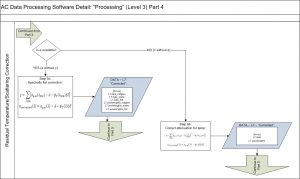
Both attenuation and absorption data are median minute-binned. Data values between 2.5% and 97.5% percentiles are used (to remove rare outliers). It is also possible to use the mean for binning.
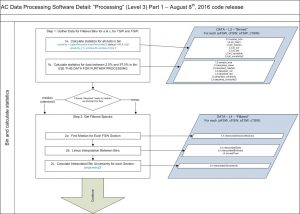
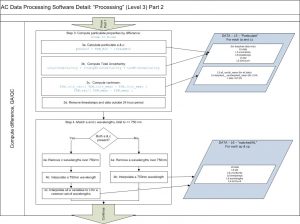
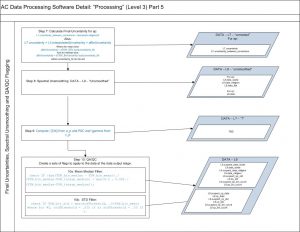
Dissolved values needed to obtain the particulate values are linearly interpolated to the time of particulate measurements. Wavelengths over 750nm are then removed and a 750 wavelength is linearly interpolated. Spectral band of absorption are interpolated to those of attenuation.
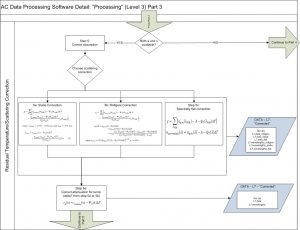
The 3rd method of Zaneveld et al., 1994 is typically used to correct for scattering with 730nm as the null wavelengths simultaneously performing a residual temperature correction (see Slade et al., 2010). Attenuation is also corrected for residual temperature. Other types of scattering corrections are also possible to choose from (e.g. Rottgers et al., 2013).
Then, a spectral unsmoothing based on the method in Chase, A., et al., 2013 is used. Finally, data is filtered out based on two criteria:
- If the bin fails the check:
(abs(TSW_bin_median – TSW_bin_mean))./(TSW_bin_median-FSW_interp_median) > max(0.3 , 0.001./(TSW_bin_median-FSW_interp_median));
- If the bin fails the check:
TSW_bin_std > stdThreshold
where the stdThreshold is .015 for a, and .030 for c.
Output
SeaBASS-compatible files are the standard output of the software, for both spectral particulate absorption (ap) and attenuation (cp). Date, time, latitude, longitude, temperature, salinity, standard deviation and bin count are included in each file, along with either the absorption or attenuation data. Spectra with negative absorption in the blue regions are kept, as these values are not significantly different from zero. In extreme cases bad values are replaced with -9999.
To facilitate human-in-th-loop QA/QC, many plots are also produced as the software runs, with final plots of the SeaBASS data produced at the end (Fig. A7).
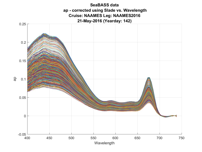
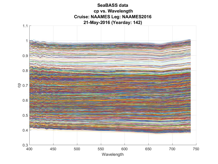
Figure A7. One-day of particulate absorption and attenuation spectra generated for human-in-the-loop QA/QC of the data generated to be submitted to SeaBASS.