2014 Maine Corn Hybrid Performance Trial
2014 Maine Corn Hybrid Performance Trial (PDF)
Rick Kersbergen, 207.342.-5971 / 800.287.1426, richard.kersbergen@maine.edu
Caragh Fitzgerald, 207.622.7546 / 800.287.1481, cfitzgerald@maine.edu
Funding provided by local seed companies and the University of Maine Cooperative Extension.
Special thanks to John Stoughton and the farm crew at Misty Meadows Farm for hosting the trial and helping with planting and harvesting.
 In 2014, the University of Maine Cooperative Extension conducted a hybrid silage corn evaluation program in cooperation with local seed dealers, Maine Farm Days and Misty Meadows Farm who hosted the trial in Clinton, Maine.
The purpose of the program is to provide unbiased performance comparisons of hybrid corn available in the central Maine area. It is important to remember that the data presented are from a single test at one location. Hybrid performance data from additional tests in different locations, and often over several years, should be compared before you make conclusions.
Testing Procedure
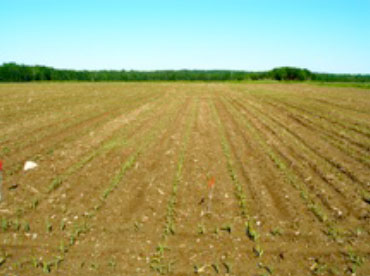
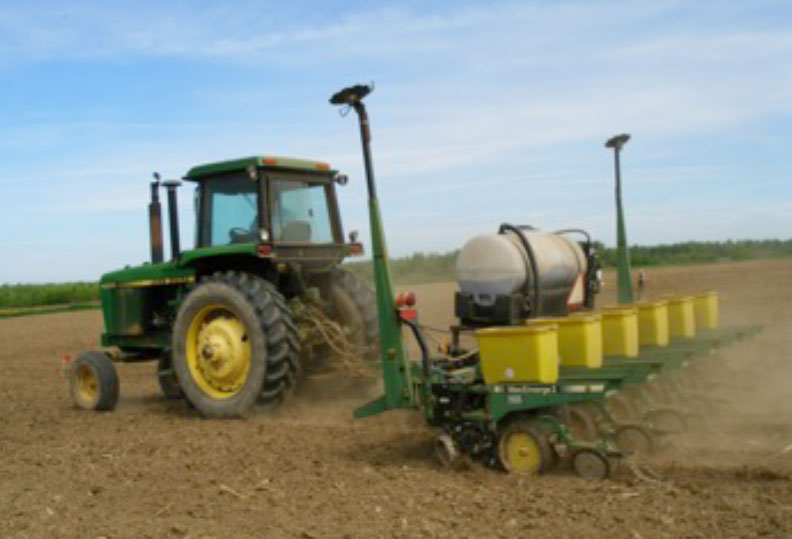 The experiment was planted at the Misty Meadows Farm in Clinton on June 2, 2014, using a six-row corn planter. The predominant soil type was Woodbridge fine sandy loam.
Prior to planting, 10,000 gallons per acre of liquid cow manure was applied to the field and incorporated by harrowing. Five gallons per acre of liquid starter fertilizer (6-21-4) was applied at planting. Verdict herbicide was applied just after planting. Fifty pounds of nitrogen were applied per acre as urea around July 4. Quilt XL fungicide was applied in the second week of August.
Three replications of 36 hybrids were planted in a randomized block design. Plots were 75 feet long and 15 feet wide with 6 rows on 30 inch centers. The hybrids used were nominated and donated by seed companies. Hybrids had relative maturity days ranging from 77 to 107 (Table 3). We targeted a planting density of 32,000 plants/acre.
The plots were harvested using a six-row corn chopper. Corn from each plot was loaded into a mixer wagon with scales. Grab samples from one replicate of each treatment were sent overnight to the Dairy One Laboratory in New York for analysis for moisture and quality using wet chemistry.
Growing degree days were calculated using temperature data collected by a temperature sensor located in the shade adjacent to the trial area. Total growing degree days (86/50) were 1933 for 2014, the third-lowest since 2007 (Table 1). The experiment was harvested on September 23, 2014. At this time, silage harvest was underway on commercial farms. A light frost had occurred at the experiment site, and a killing frost had occurred in some scattered locations in the region.
A total of 17.84 inches of rain was recorded in Waterville, Maine, by the National Weather Service between June 1 and September 22, 2014 (Table 2).
| Month | Rain (inches) |
|---|---|
| June | 5.70 |
| July | 6.67 |
| August | 4.14 |
| September | 1.33 |
| Total | 17.84 |
 Analysis of variance was conducted to identify differences between hybrid silage yield (corrected to 30% dry matter) and expected milk yield (milk per ton of dry matter multiplied by dry matter). Linear regression analysis was conducted to see the effect of relative maturity on silage yield, expected milk yield, % dry matter, and all quality parameters.
Results
Yield and Expected Milk Yield
 Yields were corrected to a standard 30% dry matter. Forage digestibility and energy content were used to project potential milk yield (milk lbs/ton of dry matter). Expected milk yield per acre was calculated by multiplying the potential milk per ton of dry matter by the tons of dry matter per acre. This serves as another measure of productivity of each hybrid. Both yield (30% DM) and expected milk yield results are shown in Table 3. Analysis of variance showed that there were significant differences among the hybrids tested for both yield (p < 0.0001) and expected milk yield (p < 0.0001). In Table 3, hybrids followed by the same letter are statistically similar (Tukey’s HSD).
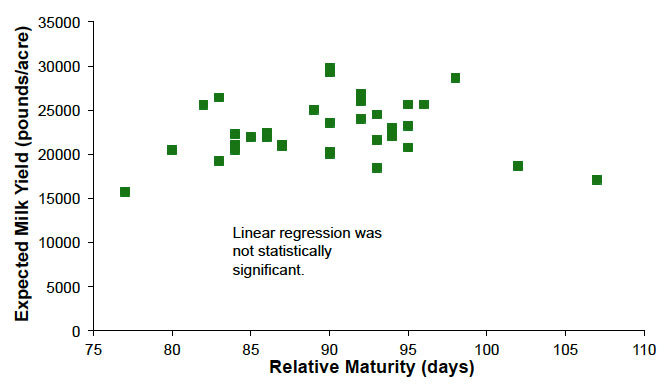
There was no linear correlation between relative maturity and yield (30% dry matter) (Figure 1) or between relative maturity and expected milk yield (Figure 2) (p=0.1712 and p=0.4037, respectively).
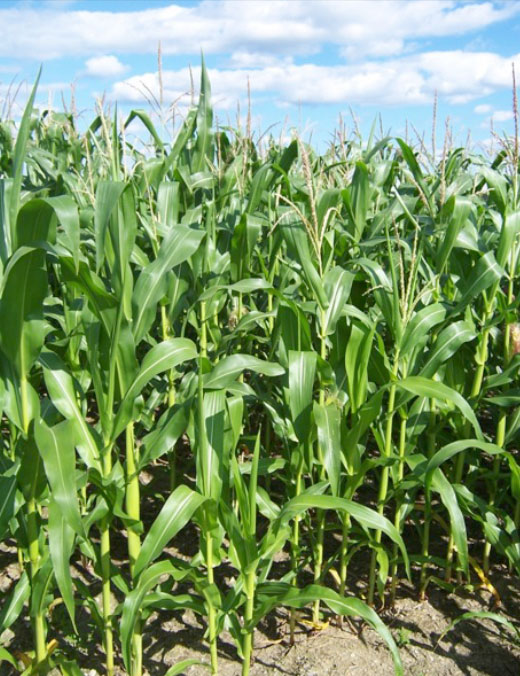
Table 3 includes data from two BMR (brown mid-rib) varieties. BMR varieties need to be evaluated for their higher digestibility and enhanced animal intake and performance if rations are balanced correctly. When comparing these varieties, producers should make sure they look at NDF digestibility (NDFD, % of NDF). Producers should segregate BMR varieties at harvest to utilize this feed with cows for specific rations, including pre-fresh, fresh and high producing groups.
*Means followed by the same latter are not statistically different (Tukey’s HSD)
** **Expected milk yield = calculated milk lbs/ton multiplied by dry matter yield. Calculated milk lbs/ton is a projection of potential milk yield per ton of forage dry matter, based on forage digestibility and energy content.
Figure 1. Effect of Relative Maturity on Corn Silage Yield (corrected to 30% DM) (2014)
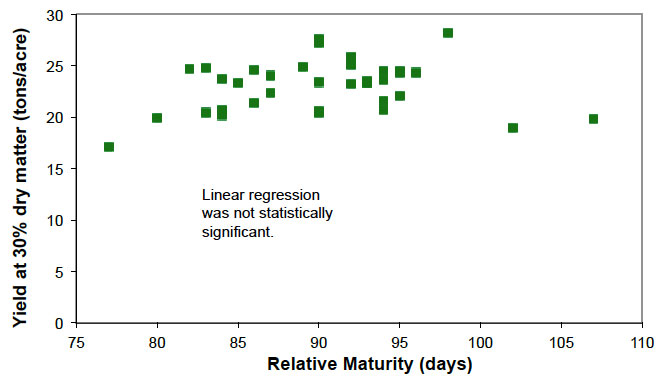
Figure 2. Effect of Relative Maturity on Expected Milk Yield Per Acre (2014)
Quality
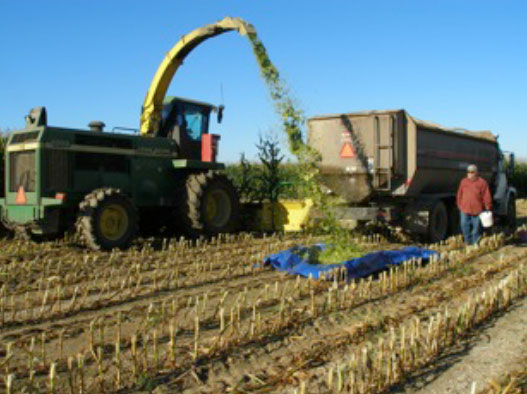 Table 4 lists select quality results for the 2014 trial.
Dry matter decreased as relative maturity increased, as shown in Figure 3. There was a significant linear effect with an r2 of 0.354. In 2014, most varieties had below-optimum dry matter due to the early harvest date.
There was also a significant linear relationship between IVTD and relative maturity and NDFD and relative maturity. Both parameters increased as relative maturity increased.
Figure 3. Effect of Relative Maturity on Dry Matter (2014)

Conclusion
After a slow start, the 2014 growing season was adequate, thanks to late-fall growth. However, an early frost triggered corn harvest in some areas, including our trial.
Although the trial location did not receive a killing frost, the frost was more severe in other locations. The subsequent weeks were warm and frost-free. In retrospect, it would have been better to delay the trial’s harvest for another few weeks and allow more varieties to reach optimum whole plant moisture for corn silage harvest.
This was the third year out of the eight years of the trial where there was no significant linear relationship between relative maturity and yield corrected to 30% dry matter. In the remaining five years of the trial, this relationship was significant but weak (low r2), and it amount to an increase of 0.97 – 1.9 tons per acre yield for every 10-day increase in relative maturity (Table 5).
In 2014, there was also no significant linear relationship between relative maturity and expected milk yield. Again, these relationships have been weak, but consistent in the past, with an increase of 91 – 3280 pounds per acre of milk expected for each 10-day increase in relative maturity (Table 5).
Shorter season hybrids offer options for improved cover crop establishment and the potential for double cropping. Although they may be slightly less productive in some growing seasons, this additional crop flexibility can significantly improve the total yield of digestible nutrients per acre. There is risk associated with choosing longer season hybrids for higher yield. Yield responses to longer maturity was greatest in the highest growing degree years, and it was not present under average growing conditions. By choosing short-season or mid-season varieties, producers help to guarantee a level of maturity and dry matter that produces quality corn silage that ferments well in the silo.
They become less vulnerable to late wet harvest years. This also opens the door for improved nutrient and soil management options such as cover cropping.
 In most years, earlier-maturing hybrids showed optimum or close to optimum dry matter content at harvest time. Later-maturing hybrids tend to show somewhat lower than recommended dry matter content at harvest. In 2014, nearly all hybrids had lower dry matter than optimum due to the early harvest. Once again, there was a significant linear relationship between relative maturity and dry matter, with later-maturing hybrids being wetter at harvest. In 2010, 2011, and 2013, hybrids with shorter maturities showed higher dry matter content than recommended, indicating that they could have been harvested earlier.
Acknowledgments
We would like to thank John Stoughton and the farm crew at Misty Meadows Farm for their help with planting, crop management, and harvest. Thanks are also extended to the seed dealers who helped with seed donation, planting, and harvesting and to staff and students who helped in the field and in the office.
| Company | Contact | Phone |
American Organics |
Dairyland |
DeKalb |
Dynagro |
Master’s Choice |
Mycogen |
NK |
Pioneer |
Schlessman |
Seedway |
|
|---|---|---|---|---|---|---|---|---|---|---|---|---|---|
| AgMatters LLC | Lauchlin Titus | 207.314.2655 | LTitus1@myfairpoint.net | x | x | ||||||||
| Crop Production Services (Office: 207.795.6640) |
Brian McCleary | 207.740.1911 (M) | brian.mccleary@cpsagu.com | x | x | x | x | ||||||
| Crop Production Services (Office: 207-795-6640) |
Franklin Leavitt | 207.944.1922 (M) | Franklin.Leavitt@cpsagu.com | x | x | x | x | ||||||
| Crop Production Services (Office: 207.795.6640) |
Randy Drown | 207.650.0310 (M) | randy.drown@cpsagu.com | x | x | x | x | ||||||
| Dairyland Seed Co. | Jim Stone | 800.236.0163 607.221.5011 |
jstone@dairyland.com | x | |||||||||
| Feed Commodities International | Al Fortin | 207.341.0968 800.462.4929 |
afortin@feedcommodities.com | x | x | ||||||||
| Feed Commodities International | Art Pellerin | 207.341.0968 | artp5800@roadrunner.com | x | x | ||||||||
| Feed Commodities International | Pat Heacock | 207.664.9812 | pheacock@feedcommodities.com | x | x | ||||||||
| Gold Star Feed and Grain, LLC | Michele Bennett | 207.754.0764 | mbennett@goldstarfeed.com | x | x | x | |||||||
| Gold Star Feed and Grain, LLC | Emilee Robertson | 207.399.6755 | erobertson@goldstarfeed.com | x | x | x | |||||||
| Kent Nutrition Group | Nick Richardson | 207.317.0469 | nicholas.richardson@blueseal.com | x | |||||||||
| King’s Agriseeds, Inc. | Rod Porter | 607.227.0836 | rodporter@kingsagriseeds.com | x | |||||||||
| Maine Seed Company | Steve Goodwin | 207.242.2339 | x | x | |||||||||
| Maine Seed Company | Tate McPherson | 207.551.8301 | tate@maineseedcompany.com | x | x | ||||||||
| MPG Crop Services | Tim Donovan | 207.877.5923 | tdonovan@mpgco-op.com | x | x | ||||||||
| Northeast Agricultural Sales (Office: 800-462-7672) |
Justin Choiniere | 802.535.9938 (M) | justin@neag.net | x | x | x | |||||||
| Northeast Agricultural Sales (Office: 800-462-7672) |
Paul Peters | 207.441.6250 (M) | paul@neag.net | x | x | x | |||||||
| Northeast Agricultural Sales (Office: 800-462-7672) |
Spencer Greatorex | 207.341.1375 (M) | svg1@adelphia.net | x | x | x | |||||||
| Paris Farmers Union | Milt Sinclair | 207.743.1291 | miltwspfu@hotmail.com | x | x | x | x | x | |||||
| Paris Farmers Union | Greg Gillespie | 207.744.5602 | gregg@parisfarmersunion.net | x | x | x | x | x | |||||
| R.E. Belanger & Son | Rick Belanger | 207.576.5845 | x | x | |||||||||
| Syngenta/NK | Alvin Winslow | 207.740.8248 | alvin.winslow@syngenta.com | x | |||||||||
| Syngenta/NK | Jonathan Stevens | 207.538.7150 | jonathan.stevens@syngenta.com | x | |||||||||
| Derek Hines | 207.717.0550 | abhines@msn.com | x | ||||||||||
| Klaus Busch | 518.320.2462 | klaus.j.busch@monsanto.com | x | ||||||||||
| Newman Gamage | 207.622.5009 (H) 207.446.5620 (M) |
x | |||||||||||
| Nick Michaud (China) | 207.649.9786 (M) | x | |||||||||||
| Warren Hood (Turner) | 207.754.1853 (M) | hoodlah@aol.com | x |