Adapting to Extreme Rainfall in Ellsworth, Maine: A General Guide to Manage Stormwater in a Changing Climate
In response to meetings held in Ellsworth, the following is a brief summary of changes in rainfall extremes as well as our recommendations for short- and long-term adaptation strategies for local stormwater management. The information provided here is derived from actual data taken from a rain gauge in Corinna (45 miles from Ellsworth) with a long history of measuring daily rainfall amounts (over 60 years).
Results from Extreme Rainfall Analysis (1950-2011):
- Extreme rainfall events are becoming more frequent. For example, a storm that produces about 3.54 inches of rain used to occur once every 50 years, but today can be expected to occur once every 12 years (Fig. 1).
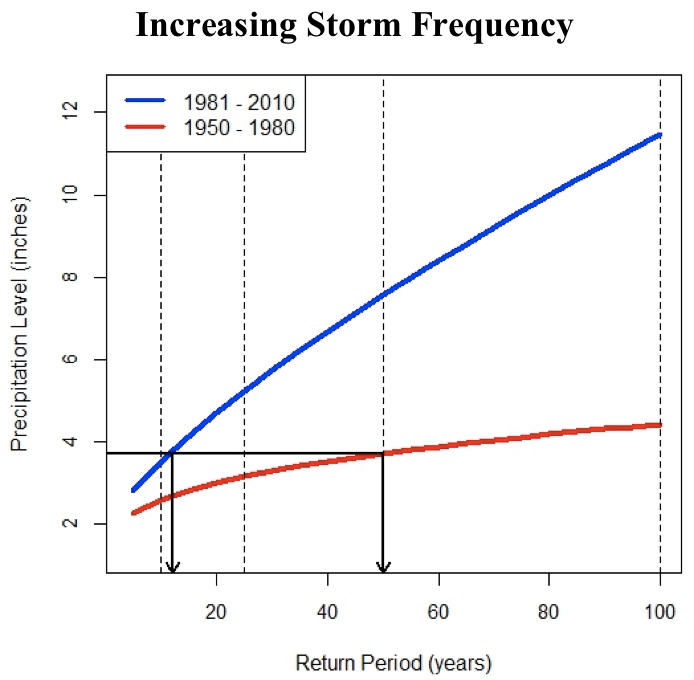
Figure 1. A graph comparing the probability of a 3.54 inch rainfall event during 1950-1980 (red line) and 1981-2010 (blue line) time periods. The red line crosses the 3.54 inch mark at a return period of 50 years (i.e., 50-year storm) while the blue line crosses the 3.54 inch mark at a return period of 12 years (i.e., 12-year storm).
- During 1950-1980, most of the extreme events were largely concentrated in the July-January period; though recent events show an increased tendency to occur in late spring and early summer (Fig. 2).
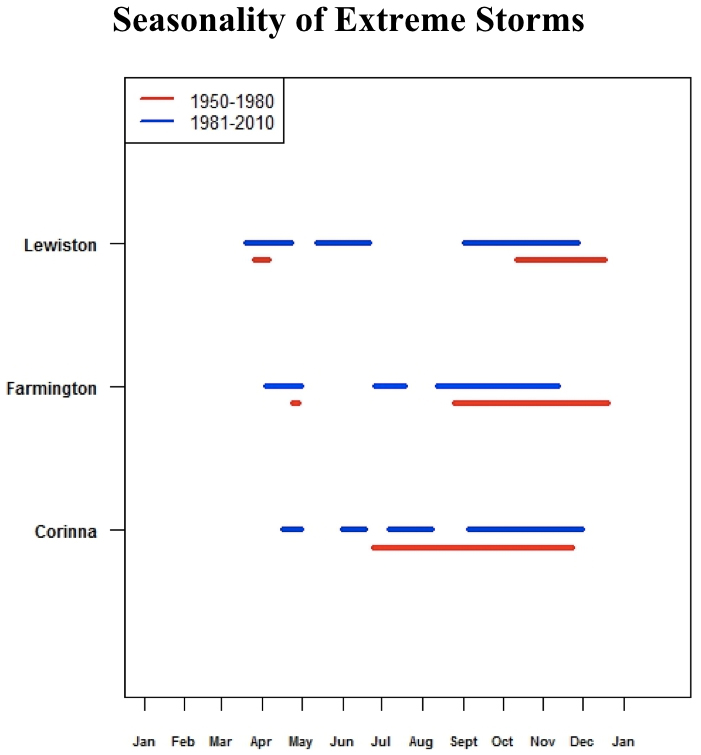
Figure 2. A graph illustrating the seasonality of extreme storm prevalence during the 1950-1980 (red lines) and 1981-2010 (blue lines) time periods for three rain gauge locations (Corinna gauge is closest to Ellsworth). Note the shift in extreme storm seasonality between the two time periods, with recent extreme storms occurring more in spring and early summer than in the past.
- Each additional unusually large storm event (e.g., hurricane Irene) changes the statistics of what would be considered “a rare storm.” As a result, culverts designed using old and outdated rainfall information are more likely to flood or fail today (Fig. 3).
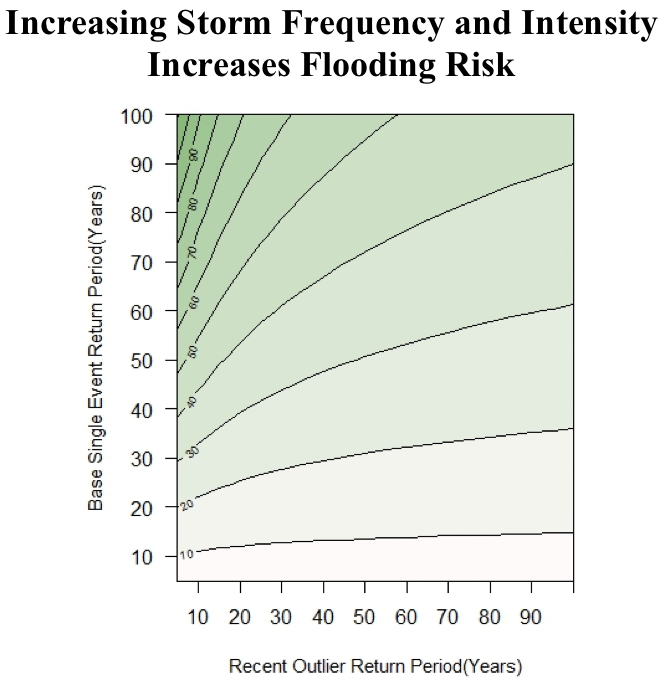
Figure 3. A graph illustrating the statistical impact of additional unusually large storm events on culverts. The red dotted arrow on the Y-axis represents a 90-year storm event while the blue dotted arrow on the X-axis represents an additional 90-year storm event. The curved purple line, located where the two dotted arrows intersect, corresponds to the statistical change from having the additional 90-year event. The additional 90-year event would now more likely represent a 42-year event. - During 1950-2011 more than a quarter of the 60 largest storm events from June-October were the result of hurricanes or hurricane remnants (Table 1).
| 1950-2011 June-October Period | |
|---|---|
| Non-hurricane-Related Rain Events | Hurricane-Related Rain Events |
| 44 | 16 |
Recommendations for Short-term Adaptation Strategies:
- Utilize a seasonal stormwater management schedule that includes tasks to prevent flooding from extreme storms not only in late summer, but late spring and early summer too (e.g., remove blockages and flush pipes).
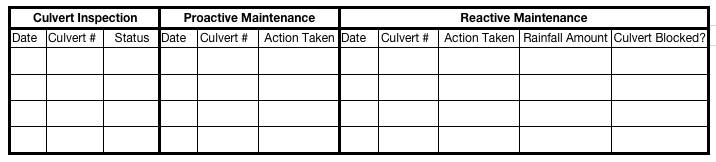
- Review the flows being experienced at culverts and compare with capacity of culverts. Create a log or database to record and assess how culvert maintenance and weather extremes are affecting overall culvert functionality:
- On existing pipes with plugging potential, add a trash rack upstream of the pipe or at the pipe entrance (inlet) to trap debris before it plugs the pipe.
- Co-develop education material with UMaine to inform residents (via citizen forum, municipal website or town mailer) about stormwater and steps they can take to limit flooding around their properties (e.g., keeping driveway culverts clear, communicating with public works). This process is already underway.
Recommendations for Long-term Adaptation Strategies:
- Culverts made of high density polyethylene (plastic) tend to last longer than those made of metal. Consideration of the lifespan of new installations should incorporate some increase in extreme rainfall amounts into the design by:
- Keeping in mind that generally the most expensive part of replacing a culvert is the excavation work and not the increasing of the culvert size.
- Explore potential solutions to thaw frozen culverts in order to accommodate extreme rainfall in early spring, such as:
- Solar assisted culvert thawing systems
- Coarse gravel fill around the culvert to allow for early natural thawing
- Portable, low-voltage electric culvert thawing system
- Consider amending culvert design ordinances as needed in order to mitigate flooding risks, including:
- Increasing design standards to accommodate the most current extreme rainfall expectations.
- Use models to design ordinances that are tailored for specific areas of Ellsworth.
- Protect the outlet of culverts against erosion. Options to improve embankment stability to ensure performance during extreme floods should be considered.
- A real-time monitoring system that could warn emergency management personnel and communities if precipitation amounts exceed the design specifications of culverts under key routes of travel.
These recommendations are general and are not meant to deter Ellsworth from identifying additional recommendations. Our project team is in the processes of further exploring these long-term recommendations by obtaining traffic data to help identify and prioritize important roads and routes in conjunction with hydrological modeling. As we have discussed, this will benefit the planning and prioritizing of roads, which, if incapacitated due to flooding or failing culverts, could not be accessed by emergency services. It is our hope that this and other analyses will help Ellsworth maintain safe roadways that might be impacted due to a changing climate.
Team Members:
- Shaleen Jain, Team Co-Leader
- Esperanza Stancioff, Team Co-Leader
- Alexander Gray, Research Assistant
- Nirajan Dhakal, Postdoctoral Fellow
![]()
![]()
![]()
![]()
![]()
Supported by National Science Foundation award EPS-0904155 to Maine EPSCoR at the University of Maine.